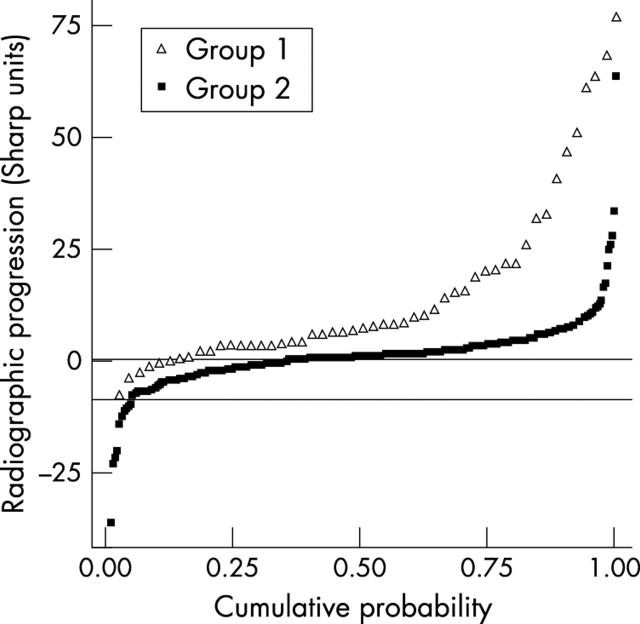
Figure 1.
Probability plot of change scores of radiographic damage of two drugs. The x axis shows the cumulative probability and the y axis the actual values. Every single observation is plotted in the curve. The horizontal lines represent a possible binomial cut off point (change of 0 and change of -7).

