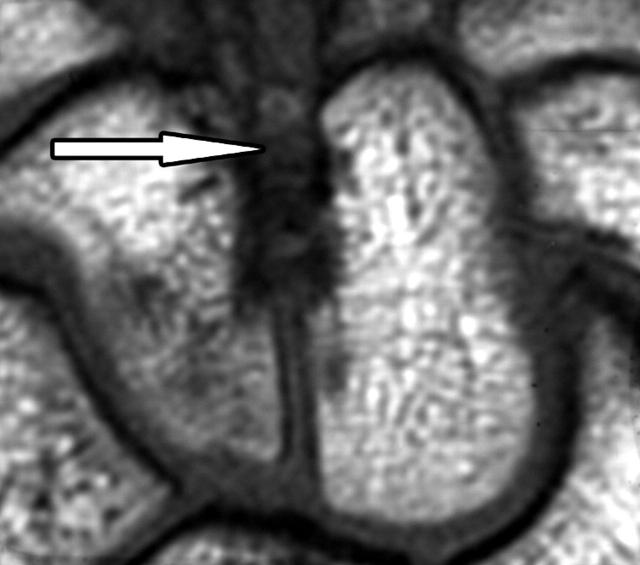
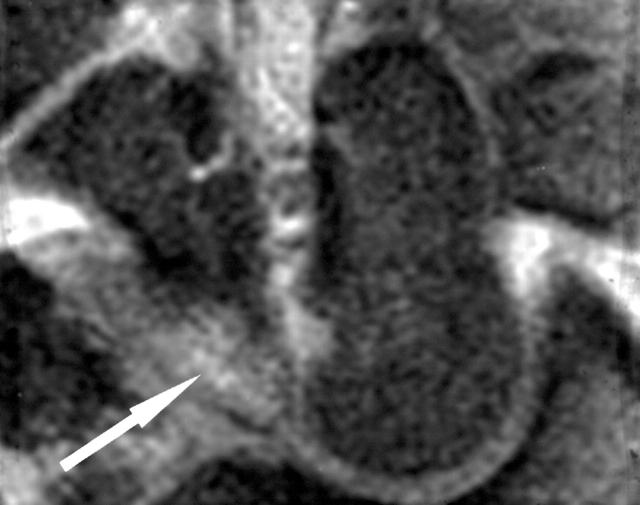
Figure 6.
(A) T1 weighted coronal image of the wrist from a patient with early RA. The interosseous ligament between the capitate and hamate blurs the inner borders of these bones distally (arrow). This appearance can mimic erosion (but erosion may also occur adjacent to this ligament). (B) On the T2 weighted fat saturated image, the ligament and adjacent synovial membrane are bright suggesting inflammation. There is also bright signal (arrow) in the hamate revealing bone oedema (seen as grey on T1 weighted image).


