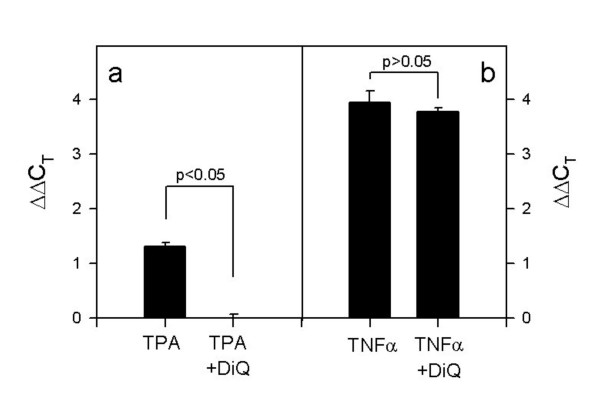
Figure 5.
S100A9 gene expression in HaCaT cells after TPA (A) and TNFα (B) stimulation. HaCaT cells were stimulated with either 100nM TPA or 50 ng/ml TNFα in the presence and absence of DiQ (20 μM) for 18 h. Then total RNA was extracted from the cells, and S100 gene expression analysis was performed by quantitative PCR analysis. Relative S100 gene expression is expressed in relation to the corresponding S100 gene expression in non stimulated cells: ΔΔCT S100 (stimulated) = ΔCT S100 (stimulated) – ΔCT S100 (non-stimulated). The number of experiments was n = 3.

