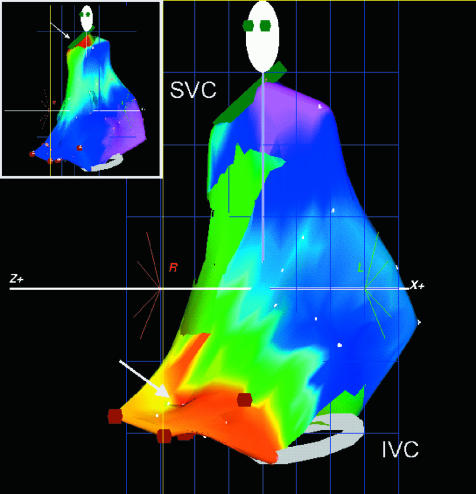
Figure 5.
An electroanatomical map of the right atrium in a patient with focal atrial tachycardia (AT). The atrium is shown in the left anterior oblique (LAO) view with the superior (SVC) and inferior vena cava (IVC) shown as rings on the map. An isochronal map has been superimposed onto the computer generated model of the right atrium. This shows early activation in red and latest activation in purple. The earliest activation can be seen at the low lateral right atrium which is in contrast to activation during sinus rhythm (inset) which is earliest at the superior lateral right atrium, the location of the sinus node.

