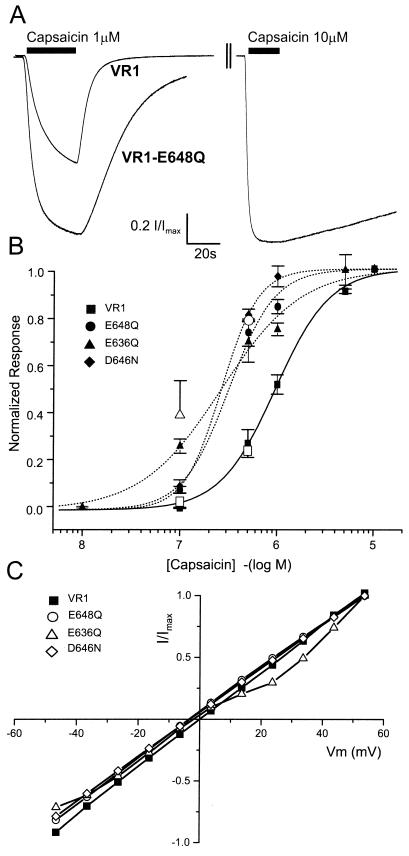
Figure 3.
Responsiveness of VR1 and mutants to capsaicin. (A) Normalized current responses by the sequential application of 1 μM and 10 μM capsaicin to cells expressing either VR1 receptors or VR1-E648Q receptors. The interstimulus interval was always longer than 5 min. (B) Capsaicin dose-response data for VR1 and mutants. Each point represents the mean ± SEM for 2EVC data from at least four independent oocytes. The solid and dashed lines are optimized fits to the Hill equation. Open symbols indicate the relative Po values obtained from single-channel records of VR1 (□), E648Q (○), and E636Q (Δ). (C) Current-voltage relationship for VR1, E648Q, E636Q, and D646N. Steady-state currents were recorded at a series of voltages in the presence and absence of 10 μM capsaicin. Plots are normalized to maximal steady-state currents. Error bars (SEM) are omitted for the sake of clarity but were always less than 0.18I/Imax.

