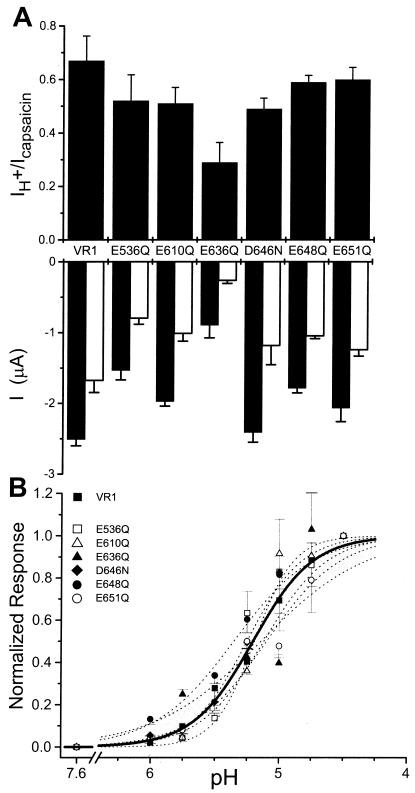
Figure 4.
Efficacy and pH dose response of VR1 and mutants. (A) Relative efficacy of capsaicin and proton activation of VR1 and point mutants. Lower bars show the absolute steady-state current responses to 10 μM capsaicin (filled) or pH 4.5 buffer (open) measured from VR1 or mutant-expressing oocytes. Each oocyte was used for only one pulse of one type of activator (n = 5–6 per activator). Upper bars show the mean IH+/Icapsaicin ratio calculated by random pairing of capsaicin and proton trials. (B) Acid dose-response curves. Currents are normalized to the maximal response elicited by the pH 4.5 buffer. Each point represents the mean ± SEM currents obtained from at least four independent experiments. The lines shown are optimized fits to the Hill equation: ■, solid thick line, VR1; dashed lines, point mutations. Vh = −25 mV.

