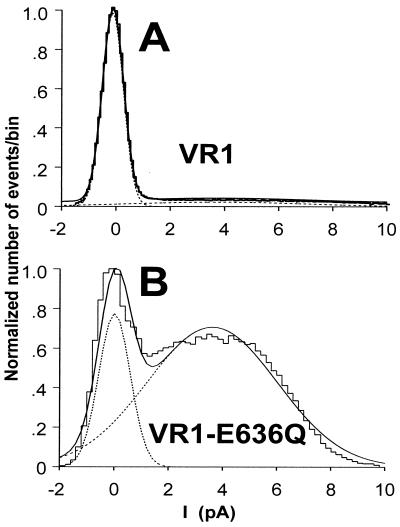
Figure 7.
All-points amplitude histograms constructed from single-channel records of VR1 and VR1-E636Q in the presence of 0.1 μM capsaicin. (A) Current values from a single-channel VR1 trace at 0.1 μM were collected in 0.2-pA bins, and the resulting histogram was fit with a second-order Gaussian (dashed lines). The sum of these fits is shown as a smooth solid line. The area under each Gaussian fit was used to calculate Po for VR1 (0.03) and VR1-E636Q (0.56).

