Abstract
Background: Complex temporal variations in coronary deaths, including diurnal, weekly, and seasonal trends, have been reported worldwide.
Objective: To describe the magnitude of seasonal changes in coronary artery deaths in New South Wales, Australia.
Design: Hospital morbidity data, mortality statistics, and meteorological data were modelled using time series techniques to determine seasonality of coronary deaths. Data were also analysed to determine whether there was an increase in deaths before or after the Christmas and New Year holidays.
Results: A clear seasonality of coronary deaths was shown, with a peak in July. A mean of 2.8 excess coronary deaths per 100 deaths was estimated to occur from June to August each year, with a mean annual excess of 224 winter deaths a year. Mortality data did not show an increase in coronary death ratios before (p = 0.626) or after (p = 0.813) the Christmas and New Year holidays in December.
Conclusions: There is a higher incidence of coronary deaths in winter, which may reflect winter respiratory infections, the direct effect of cold, seasonal changes in lipid concentration, and other factors associated with winter. Hospitals should have contingency plans during the winter months to manage larger numbers of cardiac admissions.
Keywords: coronary artery disease, mortality, seasonality
Several studies from around the world have shown a seasonal component to cardiac events and mortality, with an increase during the winter months.1–6 The higher incidence of cardiac events in the colder months has been shown in temperate, subtropical, and other climates.2,7–9 Seasonal variations have also been described for cerebrovascular disease and for all cause mortality.4,10,11 Some of the postulated reasons for these observations include colder weather and winter respiratory viruses.
It is well recognised that during the winter influenza season there is a rise in all cause mortality, often attributed to influenza and other respiratory viruses.12 In people with pre-existing cardiac disease, an acute respiratory infection can precipitate cardiac events. In addition, studies have shown seasonal variation in lipids, including cholesterol, with a rise in low density lipoprotein (LDL) cholesterol and a fall in protective high density lipoprotein (HDL) cholesterol during the winter months.13–16 One study showed daily variations in cardiac deaths, with more deaths occurring on Saturdays.1 Other studies have shown circadian variations in cardiac events, with more deaths occurring in the early morning.17,18 Trigger factors such as physical exertion, sexual activity, and environmental change may play a causative role in up to 20% of cases of acute coronary events.18 In one US study it was postulated that the holiday period, particularly Christmas, triggers cardiac events independently of the weather, presumably because of overindulgence in food.8
The pathophysiological links between external triggers such as climate or season and the onset of coronary events are important in addressing the question of a causal relation between triggers and disease onset and, perhaps, in improving preventive strategies.
Our aim in this study was to determine whether there is a seasonality in cardiac events in New South Wales (NSW), Australia, and in an area within NSW—the Western Sydney Area Health Service (WSAHS). NSW is the most populous of the five states and two territories in Australia, with a population of over six million. According to the census in 1996,19 34.6% of the Australian population live in NSW and 8.3% of the NSW population live in Western Sydney.20
We also aimed to determine whether there is an increase in cardiac events during the Christmas and New Year holiday period, as this period occurs in summer in Australia, thereby removing the confounding effect of cold weather.
METHODS
The daily death statistics were obtained from the Australian Bureau of Statistics data collection from the NSW Registry of Births, Deaths and Marriages.21 Since 1979 the principal cause of death statistics have been coded using the International classification of diseases, ninth revision (ICD-9-CM).22 All deaths caused by coronary artery disease from 1979 to the end of 1997 were examined in this study.
Hospital separation data from 1992 to 1998 were obtained from a statewide ICD-9-CM coded hospital morbidity database, the NSW inpatient statistics collection. A separation is a single episode of care (rather than an individual patient), which may end in discharge, death, or transfer. Patients admitted to a hospital with coronary artery disease were identified from the principal diagnosis ICD-9-CM code and the date of admission to hospital. Deaths occurring in hospital were also identified from the hospital morbidity dataset. Heart disease associated with coronary artery disease was chosen using the ICD-9-CM codes 410–414 (ischaemic heart disease). This group of codes includes:
410 (acute myocardial infarction)
411 (other acute and subacute forms of ischaemic heart disease)
412 (old myocardial infarction)
413 (angina pectoris)
414 (other forms of ischaemic heart disease).
We also used the following codes:
429.2 (cardiovascular disease, unspecified with arteriosclerosis, which includes arteriosclerotic cardiovascular disease and cardiovascular arteriosclerosis)
429.7 (sequelae of myocardial infarction)
429.79 (mural thrombosis, acquired after myocardial infarction).
The average daily maximum and minimum temperatures for Sydney were obtained from the Bureau of Meteorology for the period from 1992 to 1995.23 The average maximum and minimum monthly temperatures were computed by considering the population weighted maximum and minimum temperatures in Sydney Observatory Hill, Mascot, and Bankstown areas. In 1991, the estimated resident population of the coastal regions represented 87% of the NSW total, with 57% living in Sydney.24 The maximum and minimum temperatures recorded in Sydney Observatory Hill, Mascot, and Bankstown areas were used as representative temperatures for Sydney.
As we used monthly data to determine the seasonal variation, we cannot use annual population estimates to compute monthly coronary death rates. Instead of using monthly coronary deaths we used the ratio of coronary deaths per 100 deaths. This will indicate the proportion of coronary deaths which occurred in a given month relative to the total number of deaths in that month. For the 19 years of time series data, the monthly seasonal indices of coronary artery death ratios were computed using the percentage moving average or ratio to moving average method.25 The median seasonal indices were used because this is a better measure than the mean if the data are highly skewed. We did not use rates per 100 000 population because we did not have data on the incidence of cardiac disease in the population as a whole (which includes events that occur outside hospital). The data were related to hospital events, and so the denominators used were total hospital admissions and total deaths.
Data on the number of daily coronary artery deaths and admissions diagnosed as coronary artery related complications in NSW were obtained during December–January, April, and June–July. In April there are three public holidays (Good Friday, Easter Monday, and Anzac Day) in Australia, and June and July are particularly cold months, while the Christmas and New Year holidays occur in December and January. It is difficult to analyse whether there is a variation in coronary deaths during the April holidays as the date of the Easter holiday varies from year to year.
We assessed whether there was an increase in the number of deaths before or after holiday periods, particularly Christmas. Median tests with normal approximations were done to determine whether there was a difference in admissions or deaths related to coronary artery complications in the period 10 days before (14 December to 23 December) and 10 days after Christmas (24 December to 2 January), or in the New Year period (3 January to 12 January). F tests were done to assess the variation in admissions or coronary deaths during these periods. Spearman correlation coefficients were used to determine the strength of the relations between variables. The square of the Pearson product moment correlation coefficient was used as the r2 value. The r2 value is the proportion of the variance in variable y attributable to the variance in variable x.25
RESULTS
Seasonality of coronary artery death ratios
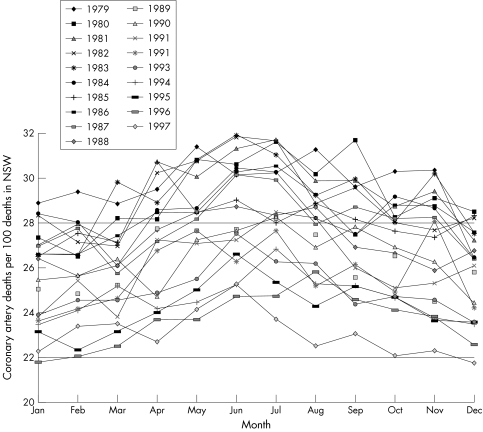
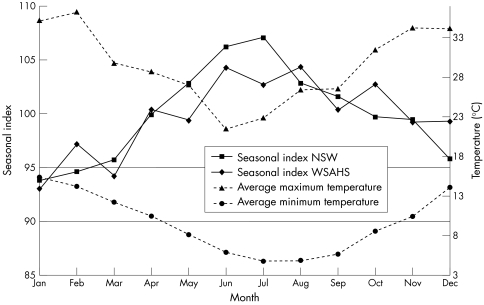
The monthly coronary death ratios per 100 deaths in NSW by year are presented in fig 1. The general pattern of monthly coronary death ratios was an inverted U shape, with higher coronary ratios during the winter months. The median seasonal indices of coronary death ratios plotted against month, and the average monthly maximum and minimum temperatures for Sydney are shown in fig 2. Although the seasonal components for Western Sydney Area Health Service were highly erratic, the variation in seasonal indices between NSW and WSAHS was not significant (p = 0.7903). The seasonal indices of coronary death ratios for NSW peaked in July and steadily fell thereafter.
Figure 1.
Monthly coronary artery deaths per 100 deaths in New South Wales (1979–1997).
Figure 2.
Seasonal indices of coronary artery death ratios for New South Wales (NSW) and Western Sydney Area Health Service (WSAHS), and average monthly maximum and minimum temperatures for Sydney (1979–1997).
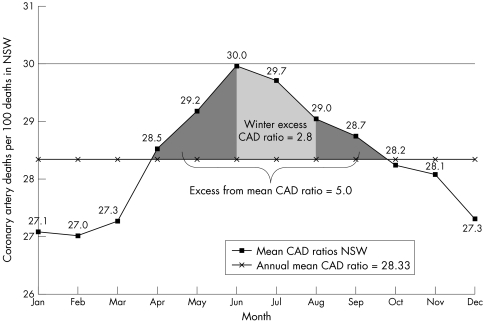
The mean coronary death ratio per month in NSW (averaged over the period 1979 to 1997) is given in fig 3. This shows that the ratio peaked in June but the highest seasonal index was in July. The annual average monthly number of coronary deaths per 100 deaths in NSW was 28.3, with a standard deviation of 1.02. On average over the 19 year period, 224 excess coronary deaths were recorded during the winter months from June to July. It was estimated that a mean of 2.8 excess coronary deaths per 100 deaths occurred from June to August each year (fig 3). Figure 3 also shows that excess deaths occurred from April to October. A 19 year mean of 100 excess deaths a year was recorded from April to October.
Figure 3.
Mean coronary artery death ratios in New South Wales (1979–1997).
Lower coronary death ratios were recorded during the summer period. The highest ratios occurred during the winter, mainly in June and July. On average the coronary death ratios were 6.6 percentage points higher during winter and 5.3 percentage points lower in summer. Monthly death ratios were negatively correlated with both minimum temperature (r = −0.411, p = 0.0001) and maximum temperature (r = −0.229, p = 0.0005).
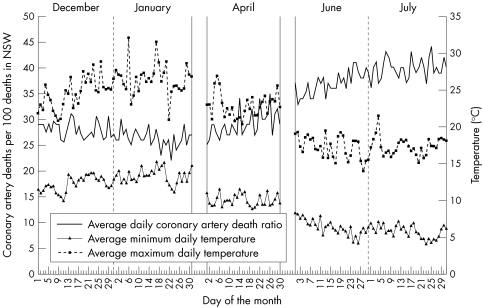
Daily deaths during holiday periods in December to January (Christmas and New Year), April (Easter holidays), and the peak coronary death period in June and July from ABS mortality data were plotted and are shown in fig 4. The median coronary death ratio per 100 deaths in NSW during Christmas and New Year was 26.8. At the 95% level of confidence, neither median difference (with normal approximation) in coronary death ratios before Christmas and New Year (27.8 coronary deaths per 100 deaths in NSW, p = 0.6260) and after (27.0 coronary deaths per 100 deaths in NSW, p = 0.8131), nor the variation in coronary death ratios before Christmas and New Year (p = 0.8281) and after (p = 0.4331) were significant.
Figure 4.
Daily coronary artery deaths per 100 deaths in New South Wales, and maximum and minimum average temperatures during the months December–January, April, and June–July.
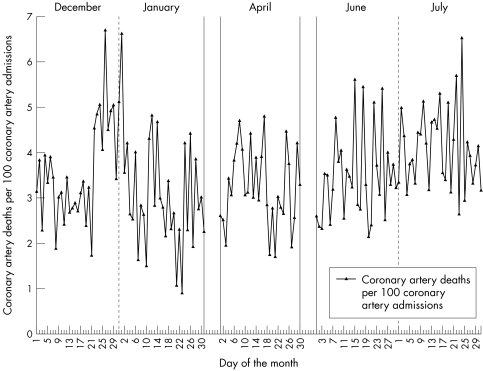
Figure 5 shows the daily coronary deaths per hundred admissions in NSW diagnosed as coronary artery related complications (1992 to 1998) in selected holiday and winter months. The daily median number of deaths before and after the Christmas and New Year holidays was around 5, but the number of daily cardiac admissions during the period 24 December to 2 January fell significantly in comparison with number of daily admissions 10 days before and 10 days after, so that the number of deaths per 100 cardiac admissions was higher during the holiday period (5 deaths per 100 cardiac admissions). The median differences (with normal approximation) in the numbers of coronary deaths per 100 cardiac admissions before and after the Christmas and New Year holidays were significant: 3.2 deaths per 100 cardiac admissions (p = 0.0017) and 2.9 deaths per 100 cardiac admissions (p = 0.0041), respectively.
Figure 5.
Daily coronary artery deaths per 100 admissions diagnosed as coronary artery related complications in New South Wales during the months December–January, April, and June–July.
In December and January there was no correlation between daily average coronary deaths and average minimum daily temperature (r = 0.0343, p = 0.8547) or average maximum daily temperature (r = 0.1041, p = 0.5775). Similarly, in April average daily deaths were not correlated with average daily minimum (r = 0.0060, p = 0.9749) or daily maximum temperatures (r = 0.0392, p = 0.8370). During the winter, when the deaths were more frequent, average daily coronary deaths were negatively correlated with the average daily minimum temperature (r = −0.5737, p = 0.0001) and the average daily maximum temperature (r = −0.1584, p = 0.2227), but only the minimum temperature effect was significant.
DISCUSSION
We have shown seasonality in the pattern of cardiac deaths in NSW and Western Sydney Area Health Service. Higher death ratios from cardiac events were recorded during the winter months, particularly in July. These findings are consistent with well described epidemiological patterns worldwide.2–4,6,7,26–28
The nature of the correlations suggested that the effect of temperature on deaths in the warmer months was small, but in the colder months the weather had a significant effect. Temperature was significantly inversely correlated with cardiac deaths, the death ratios being higher when the temperature was lower. A study done in a region of NSW showed a similar seasonal variation in cardiac events.29 A New Zealand study found that seasonal variation was more pronounced in elderly people and in men.30 Another study showed that seasonal patterns in coronary mortality in the USA have changed with time over several decades.31 These changes are thought to reflect gradual changes in microclimates, with increasing use of heating and air conditioning.31 One study found a higher rate of cardiac deaths on Saturdays than on other days of the week.1 Diurnal variation in risk, with a higher rate of cardiac events in the early morning after awakening, has also been described.18 Although the exact mechanisms for seasonal, weekly, or diurnal variations in risk may not be clear, these studies suggest that environmental triggers are risk factors for cardiac events.
Some of the effects of cold may be direct physiological effects. For example, cold increases the myocardial oxygen demand by increasing sympathetic stimulation, systolic blood pressure, and cardiac diastolic pressure and volume.15 However, there may be significant confounding factors other than temperature that affect cardiac deaths, particularly respiratory viruses such as influenza, and it is well recognised that cardiac deaths increase during the influenza season each year. However, one study which examined the effect of respiratory infections on the seasonality of cardiac events found that infections only partially explained the trend.30 Other potential confounding variables include seasonal variation in plasma lipids, which has been shown in some studies,14,32 and in one study there was a decrease in protective HDL cholesterol in the winter months.13 Variation in the level of physical activity has also been postulated as a cause of seasonal differences in cardiac events.33 Although not relevant to the temperate climate of NSW, a relation has been demonstrated between shovelling snow (physical exertion) during heavy snowfall and cardiac deaths.34
Studies in the northern hemisphere have shown a December peak, and it has been postulated that Christmas (rather than cold weather alone) is a risk factor, presumably because of dietary excesses.8 Australia is well placed to address this question, as Christmas occurs in summer, thus eliminating the confounding effect of colder weather. While we were unable to demonstrate the same relation in death ratios of cardiac events, we did find a variation in cardiac deaths per 100 hospital separations before and after Christmas. A possible explanation is a large decrease in the denominator (owing to cancelled elective cardiac admissions over the Christmas period). We have not found evidence that Christmas holidays are a risk factor for cardiac events. The association of Christmas with increased cardiac events may have been confounded by the “winter effect” in the northern hemisphere study.
Conclusions
We found a significant excess of cardiac events in the winter months, which would have an impact on hospital and community resources. Health professionals should be aware of this trend, and hospitals should have contingency plans in place for the expected increase in cardiac events during the winter. This may include opening extra beds during that period and providing extra emergency department staff. Education of hospital and community doctors may also be useful in decreasing the likelihood of missed diagnosis of acute myocardial infarction and other cardiac events in winter.
Acknowledgments
Dr Siun Gallagher, Director of the Service Development and Population Health, Westmead Hospital, initiated this study.
Abbreviations
HDL, high density lipoprotein
LDL, low density lipoprotein
NSW, New South Wales
WSAHS, Western Sydney Area Health Service
REFERENCES
- 1.Beard CM, Fuster V, Elveback LR. Daily and seasonal variation in sudden cardiac death, Rochester, Minnesota, 1950–1975. Mayo Clin Proc 1982;57:704–6. [PubMed] [Google Scholar]
- 2.Seto TB, Mittleman MA, Davis RB, et al. Seasonal variation in coronary artery disease mortality in Hawaii: observational study [see comments]. BMJ 1998;316:1946–7. [Published erratum appears in BMJ 1998;317:515.] [DOI] [PMC free article] [PubMed] [Google Scholar]
- 3.Douglas AS, Dunnigan MG, Allan TM, et al. Seasonal variation in coronary heart disease in Scotland. J Epidemiol Community Health 1995;49:575–82. [DOI] [PMC free article] [PubMed] [Google Scholar]
- 4.Douglas AS, Russell D, Allan TM. Seasonal, regional and secular variations of cardiovascular and cerebrovascular mortality in New Zealand [see comments]. Aust NZ J Med 1990;20:669–76. [DOI] [PubMed] [Google Scholar]
- 5.Piergentili P, Salmaso S, Stazi MA, et al. [Seasonal variations and trends in cardiovascular disease mortality in Naples, 1974–1978]. G Ital Cardiol 1983;13:393–8. [PubMed] [Google Scholar]
- 6.Anderson TW, Le Riche WH. Seasonal variation in ischaemic-heart-disease mortality. Lancet 1970;ii:1140. [DOI] [PubMed] [Google Scholar]
- 7.Cech I, Smolensky M, Lane R, et al. Meteorologic factors and temporal variations of cardiac mortality in an urban setting in a desert climatic zone. Israel J Med Sci 1977;13:451–9. [PubMed] [Google Scholar]
- 8.Kloner RA, Poole WK, Perritt RL. When throughout the year is coronary death most likely to occur? A 12-year population-based analysis of more than 220,000 cases [see comments]. Circulation 1999;100:1630–4. [DOI] [PubMed] [Google Scholar]
- 9.Wong C, Ma S, Lam T, et al. Coronary artery disease varies seasonably in subtropics [letter; comment]. BMJ 1999;319:1004. [DOI] [PMC free article] [PubMed] [Google Scholar]
- 10.Haberman S, Capildeo R, Rose FC. The seasonal variation in mortality from cerebrovascular disease. J Neurol Sci 1981;52:25–36. [DOI] [PubMed] [Google Scholar]
- 11.Toyama T, Adachi S. Seasonal variations of daily mortality in Tokyo City. Keio J Med 1975;24:253–60. [DOI] [PubMed] [Google Scholar]
- 12.Gross PA, Hermogenes AW, Sacks HS, et al. The efficacy of influenza vaccine in elderly persons. A meta-analysis and review of the literature. Ann Intern Med 1995;123:518–27. [DOI] [PubMed] [Google Scholar]
- 13.Manttari M, Javela K, Koskinen P, et al. Seasonal variation in high density lipoprotein cholesterol. Atherosclerosis 1993;100:257–65. [DOI] [PubMed] [Google Scholar]
- 14.Cucu F, Purice S, Schioiu-Costache L, et al. Seasonal variations of serum cholesterol detected in the Bucharest multifactorial prevention trial of coronary heart disease. Ten years follow-up (1971–1982). Romanian J Intern Med 1991;29:15–21. [PubMed] [Google Scholar]
- 15.Vuori I. The heart and the cold. Ann Clin Res 1987;19:156–62. [PubMed] [Google Scholar]
- 16.Wyndham CH, Fellingham SA. Climate and disease. South Afr Med J 1978;53:1051–61. [PubMed] [Google Scholar]
- 17.Purcell HJ, Gibbs JS, Coats AJ, et al. Ambulatory blood pressure monitoring and circadian variation of cardiovascular disease; clinical and research applications. Int J Cardiol 1992;36:135–49. [DOI] [PubMed] [Google Scholar]
- 18.Willich SN, Klatt S, Arntz HR. Circadian variation and triggers of acute coronary syndromes. Eur Heart J 1998;19(suppl C):C12–23. [PubMed] [Google Scholar]
- 19.Australian Bureau of Statistics. ABS catalogue No 2020.0. Canberra: ABS, 1997.
- 20.Australian Bureau of Statistics. ABS population data in NSW by Area Health Service Region/District, 1964 to 1998. Canberra: ABS, 1999.
- 21.Australian Bureau of Statistics. Deaths, New South Wales, 1993. Canberra: ABS, 1993.
- 22.National Coding Centre. ICD-9-CM. (Official NCC Australian version.) Sydney: Faculty of Health Sciences, University of Sydney; 1995.
- 23.Bureau of Meteorology. Temperature data for Observatory Hill, and Bankstown and Mascot airports from 1992 to 1995. Bureau of Meteorology, NSW Department of Environment and Heritage, 1995.
- 24.Department of Planning. Annual report. Sydney: Department of Planning; 1993.
- 25.Spiegal MR. Theory and problems of statistics. New York: Schaum Publishing Company; 1961.
- 26.Dunnigan MG, Harland WA, Fyfe T. Seasonal incidence and mortality of ischaemic heart-disease. Lancet 1970;ii:793–7. [DOI] [PubMed] [Google Scholar]
- 27.Douglas AS, Allan TM, Rawles JM. Composition of seasonality of disease. Scott Med J 1991;36:76–82. [DOI] [PubMed] [Google Scholar]
- 28.Narang R, Wasir HS. Seasonal variation in the incidence of hypertension and coronary artery disease [letter]. Int J Cardiol 1996;56:90–2. [DOI] [PubMed] [Google Scholar]
- 29.Dobson AJ, Alexander HM, Al-Roomi K, et al. Coronary events in the Hunter region of New South Wales, Australia: 1984–1986. Acta Med Scand Suppl 1988;728:84–9. [DOI] [PubMed] [Google Scholar]
- 30.Marshall RJ, Scragg R, Bourke P. An analysis of the seasonal variation of coronary heart disease and respiratory disease mortality in New Zealand [see comments]. Int J Epidemiol 1988;17:325–31. [DOI] [PubMed] [Google Scholar]
- 31.Seretakis D, Lagiou P, Lipworth L, et al. Changing seasonality of mortality from coronary heart disease. JAMA 1997;278:1012–14. [PubMed] [Google Scholar]
- 32.Mustad V, Derr J, Reddy CC, et al. Seasonal variation in parameters related to coronary heart disease risk in young men. Atherosclerosis 1996;126:117–29. [DOI] [PubMed] [Google Scholar]
- 33.Dannenberg AL, Keller JB, Wilson PW, et al. Leisure time physical activity in the Framingham Offspring Study. Description, seasonal variation, and risk factor correlates. Am J Epidemiol 1989;129:76–88. [DOI] [PubMed] [Google Scholar]
- 34.Persinger MA, Ballance SE, Moland M. Snow fall and heart attacks. J Psychol 1993;127:243–52. [DOI] [PubMed] [Google Scholar]


