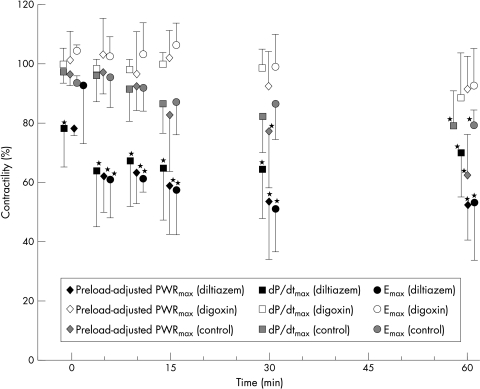
Figure 3.
Changes in contractility after drug administration. All values are means (with SD) and are expressed as percentages of the values before drug administration. *p < 0.0001 compared with values before drug administration. Emax, the slope of the end systolic pressure–volume relation; dP/dtmax, maximum rate of change of left ventricular pressure; PWRmax, maximal ventricular power.

