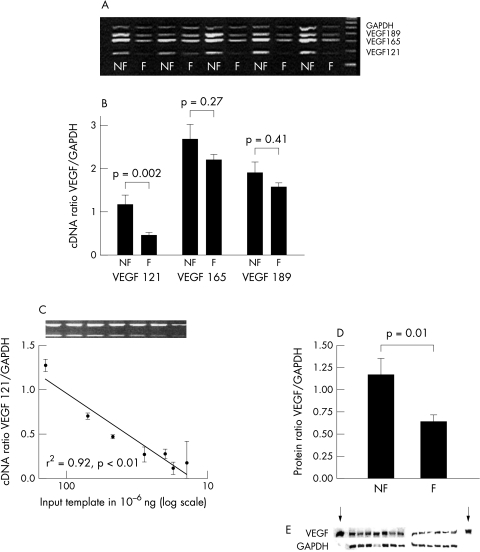
Figure 1.
(A) Ethidium bromide stained 1.5% agarose gel of expression of mRNA of VEGF and GAPDH in heart tissue from patients (failing or F) and controls (non-failing or NF). (B) Plot showing the mean cDNA ratios for VEGF121, VEGF165, and VEGF189, normalised for GAPDH. (C) Plot showing a significant correlation (Spearman) between the increasing doses of VEGF121 input template and its ratio with GAPDH. (D) Plot showing the mean protein ratios for VEGF/GAPDH. Corresponding Western blots are displayed in E; arrows indicate positive controls.

