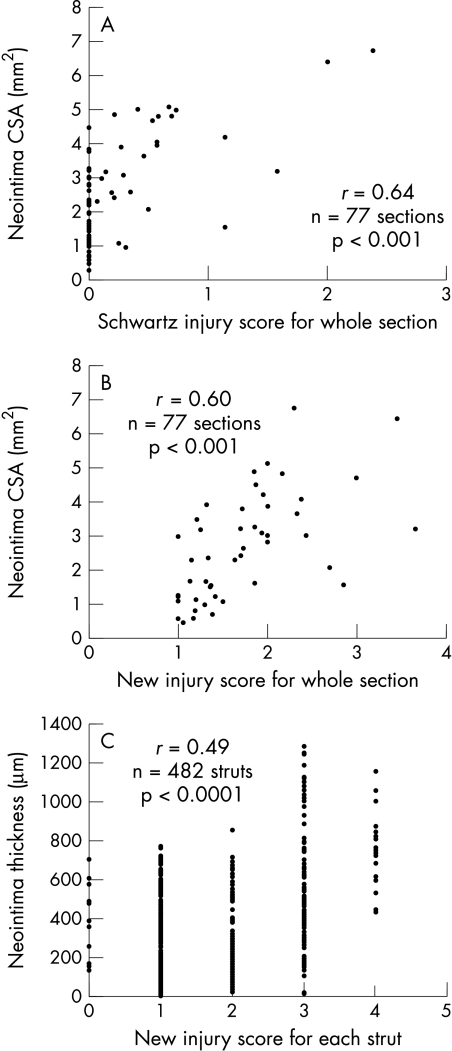
Figure 6.
Correlations between injury scores and neointimal growth at 28 days. (A) and (B) show aggregate scores for the whole section versus neointima area: (A) Schwartz score; (B) a new score. Note the clustering around zero with the Schwartz score. There is better spread with the new score, which adequately represents stretch. (C) Individual neointimal thickness at each strut plotted against new scores for each strut. There is a positive correlation but it is no stronger than that between the injury score for the whole section and total neointimal area.

