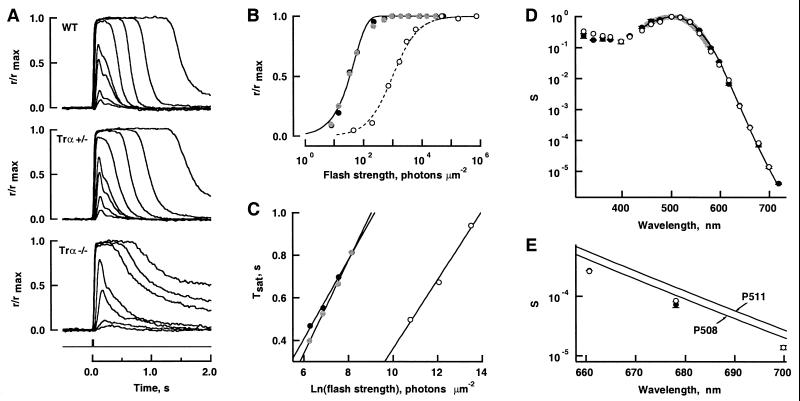
Figure 4.
Flash responses of single cells. (A) Averaged responses of WT, Trα +/−, and Trα −/− cells; maximal amplitudes were 9, 13, and 13 pA, respectively. Flash monitor is shown by the Bottom trace. (B) The stimulus-response relation for flashes at 500 nm for WT (●), Trα +/− (gray symbols), and Trα −/− (○) cells in A. Some traces were omitted in A for clarity. WT and Trα +/− results were fit with (continuous lines): r/rmax = 1 − exp(−ki), where i was flash strength, k was ln(2)/i0, and i0 was the flash producing a half-maximal response. i0 was 36 and 35 photons⋅μm−2 for WT and Trα +/−, respectively. Trα −/− results were fit with the Michaelis–Menten relation (broken line): r/rmax = i/(i+ i0), where i0 = 1,000 photons⋅μm−2. (C) Recovery from response saturation. Saturation time (Tsat) was measured from midflash to 0.8 rmax on the falling phase of the saturated responses in A. A linear fit of Tsat to the natural logarithms of the flash intensities yielded the slopes: 0.186, 0.217, and 0.162 s for WT, Trα +/−, and Trα −/−, respectively. (D) Spectral sensitivities of four WT rods (●) and the responsive Trα −/− cell (○). The mean relative sensitivity and standard error at each wavelength were computed from the log S(λ) values. The fit of collected results with: S(λ) = {exp[70(0.88 − λmax/λ)] + exp[28.5(0.924 − λmax/λ)] + exp[−14.1(1.104 − λmax/λ)] + 0.655}−1 (thin black line; ref. 23), weighted by S(λ)−1, yielded a λmax of 503 nm. The difference spectrum of rhodopsin extracted from WT retinas had a maximum at 502 nm (thick gray line). (E) The spectral sensitivity from D on expanded axes. The two continuous lines show spectra predicted for pigments with maxima at 508 and 511 nm.

