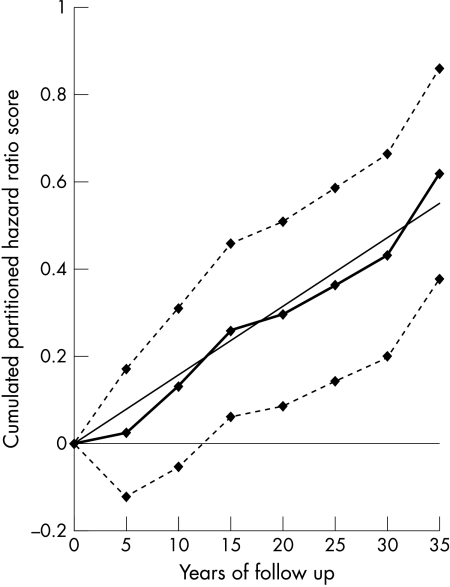
Figure 1.
Cumulated partitioned hazard ratio scores for age in the prediction of deaths from coronary heart disease (CHD) during 35 years. Thick line indicates cumulated partitioned hazard ratio scores; dotted lines indicate upper and lower confidence limits; straight line indicates fitted regression equation.

