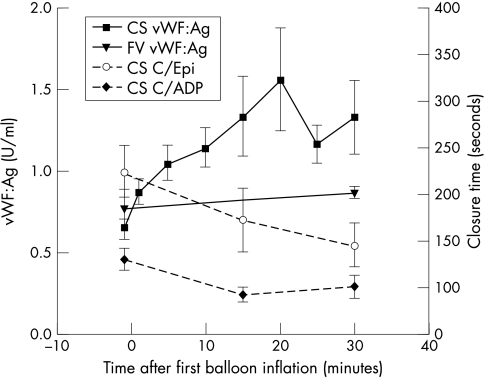
Figure 1.
Effect of angioplasty. Values represent mean (SEM); *p < 0.05, comparison with pre-angioplasty concentrations. CS, coronary sinus; FV, femoral vein; vWF:Ag, von Willebrand factor antigen, C/Epi, closure time in response to collagen/epinephrine; C/ADP, closure time in response to collagen/ADP.

