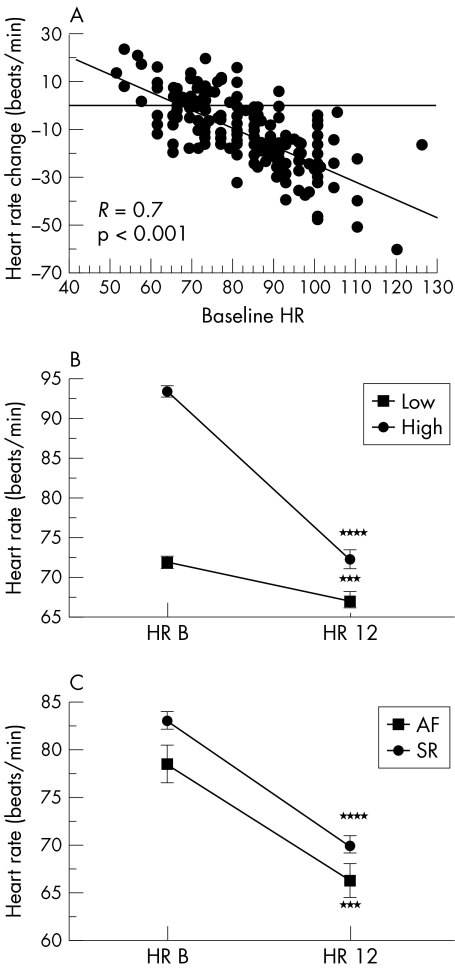
Figure 1.
Relation between heart rate reduction, baseline heart rate, and heart rhythm. (A) Linear regression plot of heart rate change after 12 months of carvedilol v baseline heart rate (BHR). (B) and (C) Mean heart rate (with standard error bars) measured at baseline (HR B) and after 12 months of carvedilol (HR 12), stratified according to high and low BHR groups (B) and according to baseline rhythm (C). AF, atrial fibrillation; SR, sinus rhythm. ***p < 0.001 v baseline; ****p < 0.0001 v baseline.

