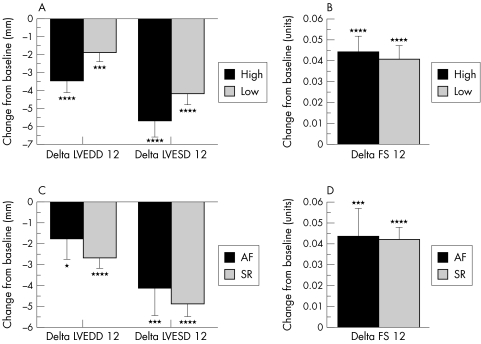
Figure 3.
Histograms showing changes in values of echocardiographic variables between baseline and follow up echocardiograms, stratified into high and low baseline heart rate (BHR) groups (panels A and B) and into atrial fibrillation (AF) and sinus rhythm (SR) groups (panels C and D). Data are plotted as means with standard errors. AF, atrial fibrillation; LVESD, left ventricular end systolic dimension; SR, sinus rhythm. *p < 0.1 v baseline; ***p < 0.005 v baseline; ****p < 0.0001 v baseline. There were no significant differences between groups for any of the measured variables.

