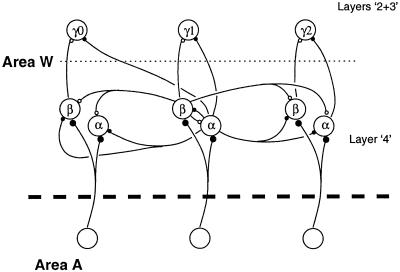
Figure 3.
Schematic neuroanatomy for area W and its input. The thick dashed line separates area A from area W; the thin dotted line separates layers 2 + 3 from layer 4 in area W. Small filled circles indicate excitatory connections, whereas small open circles indicate inhibitory connections. The connections of a typical α-cell and a typical β-cell, both shown in the center, are sketched. In the simulations, area W is small, containing 325 neurons of each α- and β-type, and a given cell makes synapses on 15–30% of these cells. Our simulation contains 10 different γ-cells, each selective for a different temporal pattern. Each γ-cell receives inputs from 30–80 cells of each type, α and β.

