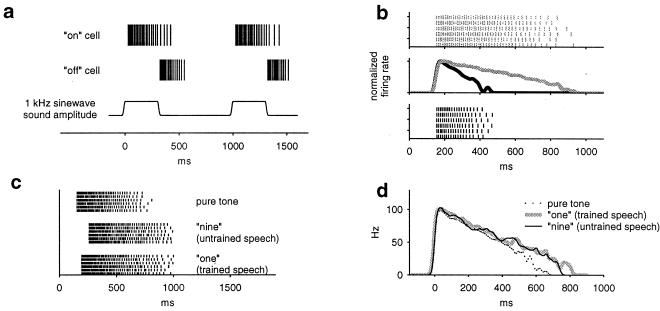
Figure 5.
Responses of layer 4 area W cells. (a) The spike rasters for a typical onset cell and a typical offset cell in response to sine wave pulses (format as in Fig. 4a). (b) Responses of two different onset cells to six different trials with the same pure tone onset (format as in Fig. 4b). (c) The response of an onset cell to three different stimuli, a pure-tone step, the word “one,” and the word “nine” (format as in Fig. 4e). (d) Histograms of the responses of e shifted into a common response onset time (format as in Fig. 4f).

