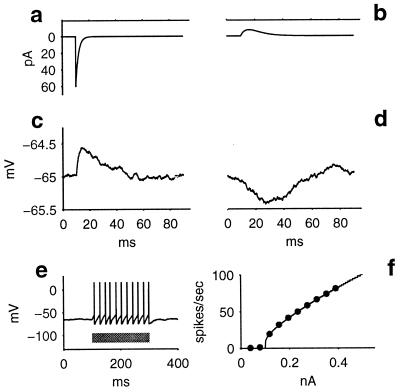
Figure 6.
Whole-cell recordings from α- and β-cells in layer 4. (a–d): A minimal stimulation protocol was used to observe synaptic responses caused by the activation of a single axon afferent to the recorded cell. (a) Excitatory postsynaptic current measured in a β-cell under voltage-clamp conditions. (b) Inhibitory postsynaptic current measured in an α-cell. (c) Excitatory postsynaptic potentials measured in the same cell as in a. Resting state here corresponds to the cell's resting membrane potential, −65 mV. (Because noise is present in all real biological systems, here and in all other simulations, independent white Gaussian noise with SD = 0.2 mV was added to the neuron's membrane potential at each 0.1-ms timestep.) The trace shown is the average of 1,000 repeats. (d) Inhibitory postsynaptic potentials measured in the same cell as in b. (e) Spiking response to an above-threshold current step, showing no spike-frequency adaptation. Gray bar indicates the time during which current was injected. (f) Firing rate of an α-cell as a function of input current. Points are the experimental measurements, and the solid line is a calculated fit to these points, based on a leaky integrate-and-fire model of the cell.

