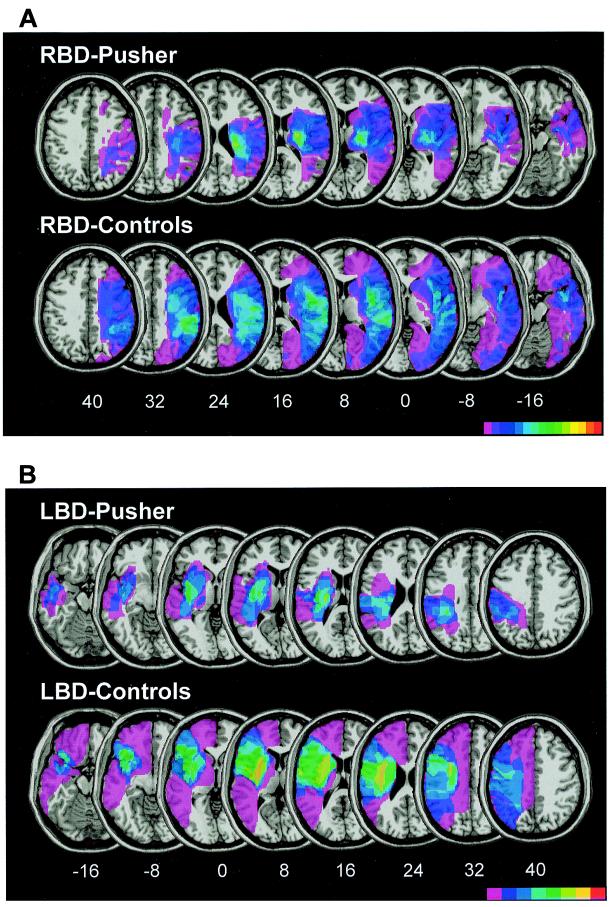
Figure 1.
(A) Overlay plots of the infarcted areas of 15 patients with contraversive pushing after unilateral right hemispheric lesions and their 15 controls without pushing. Using MRICRO software (www.psychology.nottingham.ac.uk/staff/crl/mricro.html), the lesions were mapped on slices of a template MRI scan from the Montreal Neurological Institute (www.bic.mni. mcgill.ca/cgi/icbm_view), which was normalized to Talairach space (14). The z-coordinates of each transverse section are given. The number of overlapping lesions is illustrated by different colors coding increasing frequencies from violet (n = 1) to red (n = 15). RBD, right-brain-damaged. (B) Overlay plots of the infarcted areas of 8 patients with contraversive pushing after unilateral left hemispheric lesions and their 8 controls without pushing. LBD, left-brain-damaged.

