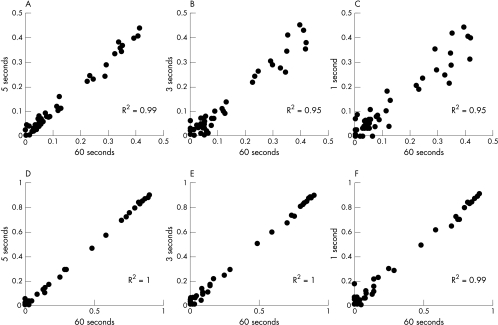
Figure 2.
Correlation between the fit parameters calculated from Raman spectra acquired in 60 seconds (x axis), and the fit parameters calculated from Raman spectra that were acquired in respectively 5 seconds, 3 seconds, and 1 second (y axis). Panels A, B, and C: cholesterol; panels D, E, and F: calcification.

