Figure 2.
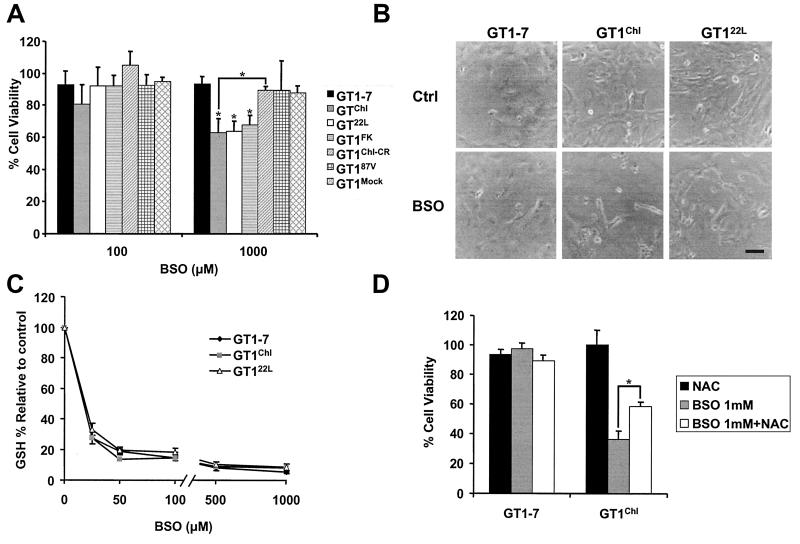
(A) Cell viability evaluated by a modified MTT assay was measured in GT1 cell lines after BSO challenge. Each of the infected lines, GT1Chl, GT122L, and GT1FK, presented an increased sensitivity to 1,000 μM BSO when compared with control GT1–7, GT187V, and GT1Mock. CR-treated cells, GT1Chl-CR, recovered a normal phenotype when compared with infected GT1Chl cells. [Bars represent means ± SD; and *, P < 0.01 (Student's t test)]. (B) The phase contrast microscopy of BSO-challenged GT1 lines showed an intense cell death in the infected cell lines GT1Chl and GT122L when compared with control GT1–7. (C) Total glutathione levels (GSH) were similar in all cell lines and decreased alike on treatment with various concentrations of BSO. (D) N-acetylcysteine preincubation (1 h; 1 mM) showed a significant protective effect on cell viability in the presence of 1 mM BSO. [Bars represent means ± SD; and *, P < 0.01 (Student's t test)].

