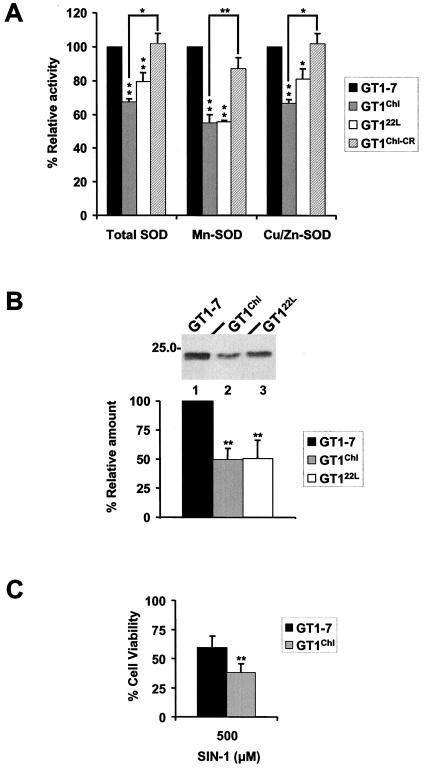
Figure 3.
(A) SOD activities present in the cultures were measured by using the xanthine and Nitro Blue Tetrazolium technique. Total, Mn, and Cu/Zn SOD activities are all significantly lower in both infected lines, GT1Chl and GT122L, when compared with control lines GT1–7 and GT1Chl-CR lines. [Bars represents means ± SD; *, P < 0.05; and **, P < 0.01 (Student's t test)]. (B) Cell lysates of GT1 lines were prepared as in Fig. 1A and the total protein concentration measured by using the BCA Protein Assay Kit (Pierce). Equal amounts of protein were Western blotted by using an anti-Cu/Zn SOD sheep polyclonal antibody from Calbiochem (Upper). Specific Cu/Zn SOD bands (Upper) and from three other experiments were quantitated by densitometry, and plotted as a percentage of the total amount in GT1–7 cells. Infected cells presented a significant decrease in Cu/Zn SOD signal. [Bars represent means ± SD; and **, P < 0.01 (Student's t test)]. (C) Cell viability evaluated by a modified MTT assay was measured in GT1Chl and GT1–7 cells after SIN-1 challenge. GT1Chl cells presented an increased sensitivity to 500 μM SIN-1 when compared with control GT1–7 cells. [Bars represents means ± SD; and **, P < 0.01 (Student's t test)].

