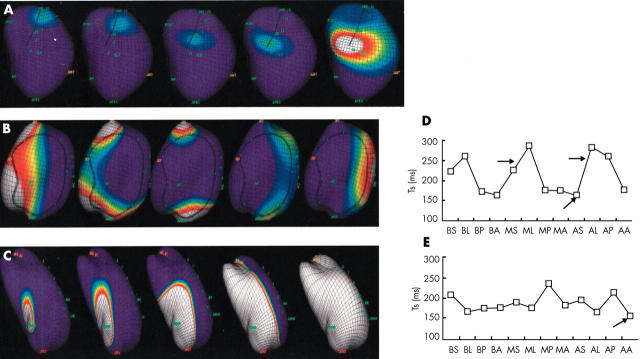
Figure 1.
(A–C) Isopotential maps showing the left ventricular (LV) activation sequences. (A) From left to right: left bundle branch activation. (B) Activation sequences across the LV anterior wall. The depolarisation wavefront splits when approaching the conduction block area (circled by the dark line). The two wavefronts merged in the lateral wall. (C) The endocardial activation originated from the apical anterior area and propagated across the LV without acute change of direction. (D and E) Corresponding sequences of LV systolic movement in various segments shown by tissue Doppler imaging. (E) The earliest peak systolic movement was located at the apical anterior segment (arrow). There was “homogeneous” propagation across the left ventricle as reflected by relatively minor difference in TS between the LV segments. (D) The earliest peak systolic movement was located at the apical septal area corresponding to left bundle activation (lower arrow). There was a major difference in TS particularly between septal and lateral LV regions (upper arrows), which was related to the anterolateral conduction block detected by isopotential maps. AA, apical anterior; AL, apical lateral; AP, apical posterior segment of LV wall; AS, apical septal; BA, basal anterior; BL, basal lateral; BP, basal posterior; BS, basal septal; MA, midanterior; ML, mid lateral; MP, mid posterior; MS, mid septal; Ts, time from the onset of QRS complex to peak systolic velocity in each LV segment by tissue Doppler imaging.

