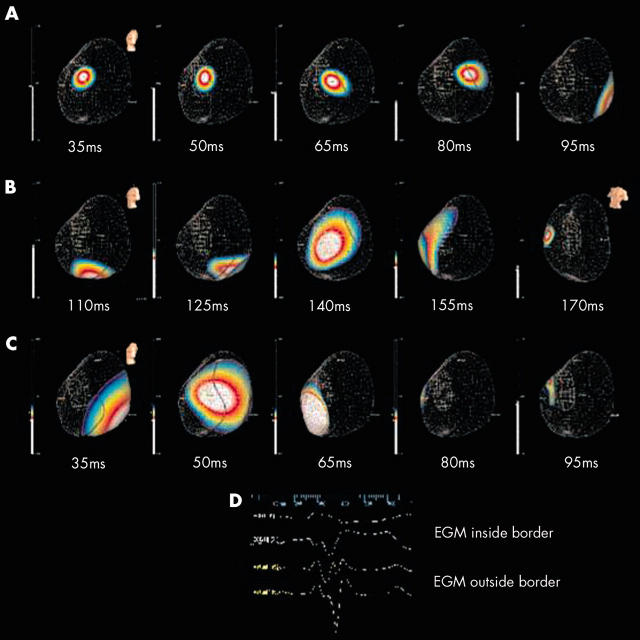
Figure 2.
The effects of pacing inside and outside the slow conduction regions. Voltage colour scale is displayed left with maximum negative depolarisation shown in white. Orientation of the left ventricle is illustrated by the torso. Rows A and B show coronary sinus pacing in a slow conduction region. Times are referenced from the pacing stimulus. After leaving the slow conduction region (black boundary highlighted with white arrows), activation proceeds toward the apex and posterior left ventricle, concluding septally 170 ms post-pace. Row C shows left ventricular rove pacing outside the slow conduction region. Activation spreads rapidly in a more homogeneous pattern, concluding septally after 95 ms. Endocardial pacing only reduced the time to local activation by 4 ms compared with epicardial pacing. (Colour gain is set high for first three frames to view low amplitude slow moving potentials.) Row D: two non-contact electrograms beneath two ECG tracings. Electrogram 1 is from a region of slow conduction and electrogram 2 from a normal region less than 2 cm away. The RMS of slow activating waveform is less than 50% of that of electrogram 2.

