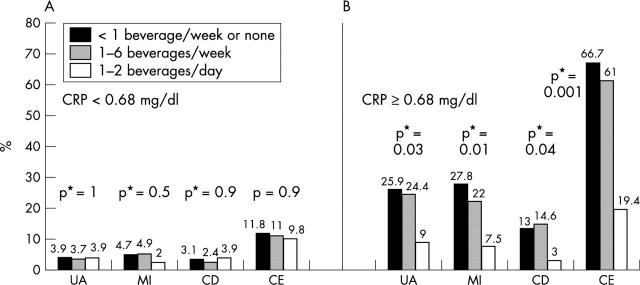
Figure 3.
Distribution of the four year composite primary end point or its components among the subgroups defined by alcohol consumption in patients with CRP concentrations of < 0.68 mg/dl (A) or ⩾ 0.68 mg/dl (B). CD, cardiac death; CE, composite primary end point; MI, non-fatal myocardial infarction; p* = p for trend.

