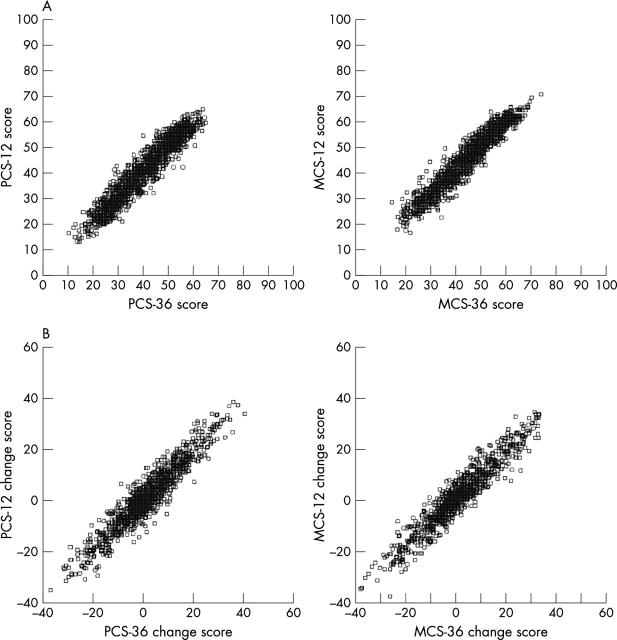
Figure 1.
Correlation between SF-12 and SF-36 summary scores. (A) Correlation between baseline physical component summary 12 (PCS-12) and PCS-36 scores and baseline mental component summary 12 (MCS-12) and MCS-36 scores. (B) Correlation between PCS-12 and PCS-36 change scores and between MCS-12 and MCS-36 change scores (12 months – baseline).

