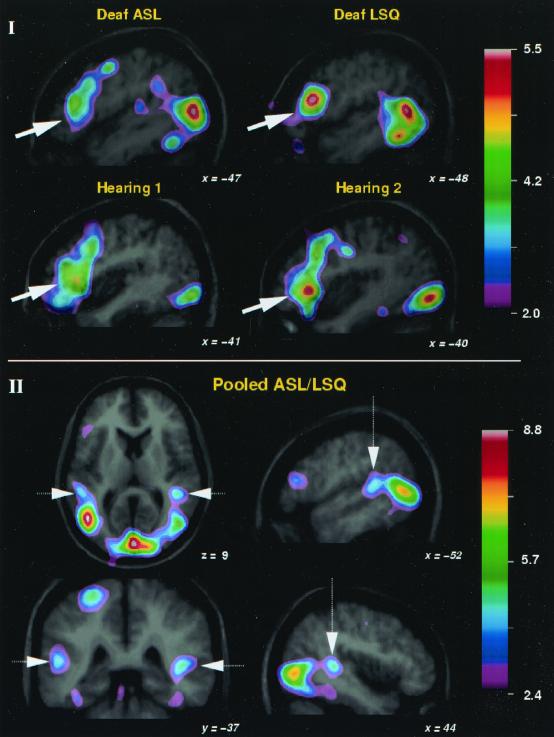
Figure 1.
Common patterns of cerebral activation in two groups of deaf people using two different signed languages, ASL and LSQ, and in two groups of hearing controls, including hearing persons viewing printed nouns in English that were semantically identical to the nouns presented in ASL (hearing 1), and hearing persons viewing printed nouns in English that were semantically identical to the nouns presented in LSQ (hearing 2). (I) Averaged PET subtraction images are shown superimposed on the averaged MRI scans for the verb generation (condition v)–visual fixation (condition i) comparison in each of the four groups of deaf and hearing Ss. Focal changes in rCBF are shown as a t-statistic image, values for which are coded by the color scale. Each of the saggital slices taken through the left hemisphere illustrate the areas of increased rCBF in the LIFC (white arrow), which were common across all four groups. Also visible are regions of posterior activity corresponding to extrastriate visual areas that are different in deaf and hearing because of the different visual stimuli used (moving hand signs vs. static printed text). (II) PET/MRI data for the pooled comparison including all conditions in which signs or linguistically organized nonsigns were presented compared with baseline, averaged across all 11 deaf Ss (see Table 2). The saggital, coronal, and horizontal images show the area of significant rCBF increase located within the STG in each hemisphere. Also visible are areas of increased activity in striate and extrastriate visual cortex. Left side of images correspond to left side of brain.

