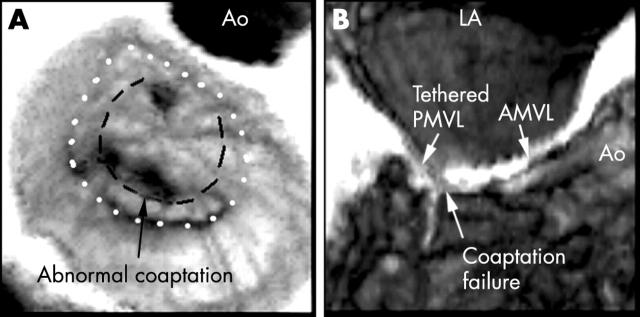
Figure 5.
An example showing that despite a good en-face view the pathology was best visualised in the longitudinal cut plane through A2–P2. The dotted line demarcates the mitral annulus and the dashed line shows the closure line between the two leaflets. The coaptation failure seen in the middle segment of the closure line was caused by tethering of P2. A2–P2, middle scallops of anterior and posterior leaflets; AMVL, anterior mitral valve leaflet; Ao, aorta; LA, left atrium; PMVL, posterior mitral valve leaflet.

