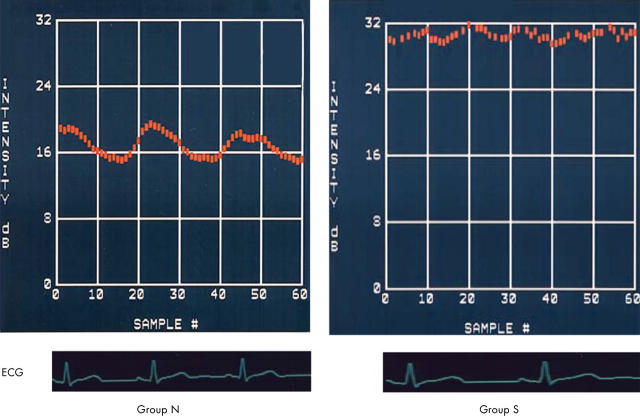
Figure 3.
Representative CV-IB curves in the basal interventricular septum in patients of group N (left) and group S (right). The magnitude of CV-IB was significantly greater in the patients of group N than in the patients of group S. The CV-IB pattern was synchronous in group N but asynchronous in group S.

