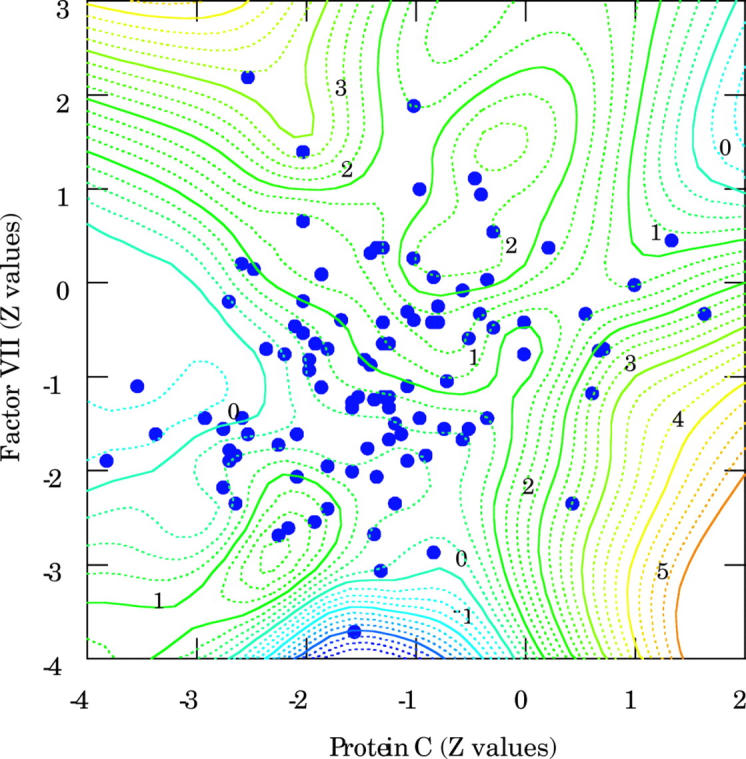
Figure 6.

Two dimensional contour graph illustrating the relations between factor VII, protein C, and antithrombin III. The contours of the z axis and the numbers in italics represent the Z values of antithrombin III. All patients with decreased protein C and normal factor VII had either normal or increased antithrombin III concentration.
