
Figure 2.
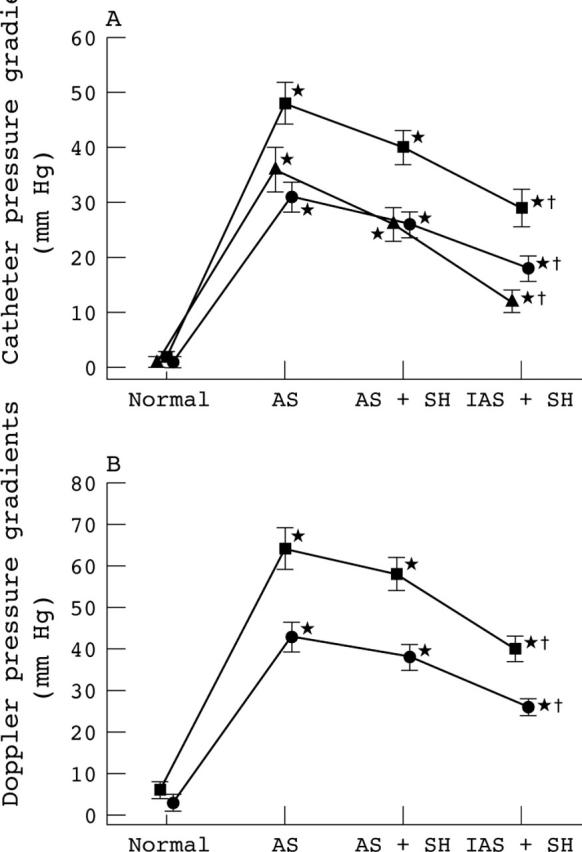
Changes in (A) catheter and (B) Doppler pressure gradients (maximum (▪); mean (•); peak to peak (▴)) in all animals of groups A and B (n = 24) during induction of aortic stenosis (AS) and systemic hypertension (SH) (mild: AS+SH I; severe: AS+SH II). *Significant difference v normal stage; †significant difference between severe stenosis + SH (AS+SH I or AS+SH II) stages and the severe stenosis (AS) stage. The error bars represent SEM.