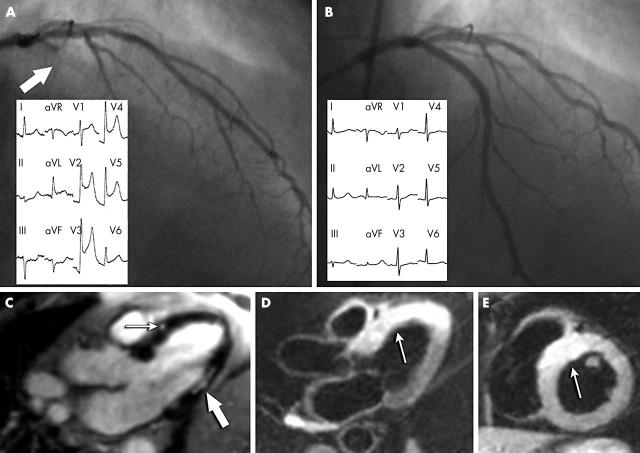
Figure 1.
Coronary angiographies (main pictures) and 12 lead ECG (windows) (A) showing acute intrastent thrombosis of the left descending artery (arrow) and (B) after percutaneous coronary intervention. (C) magnetic resonance imaging three days after the acute event in long axis view shows an area of late enhancement in the inferolateral wall compatible with the old myocardial infarction (thick arrow) and a spot of minimal hyperenhancement (“necrosette”) in the mid-segment of the anterior septum (thin arrow). A significant area of oedema is visible in T2 weighted images in the (D) long axis and (E) short axis.

