
Figure 3.
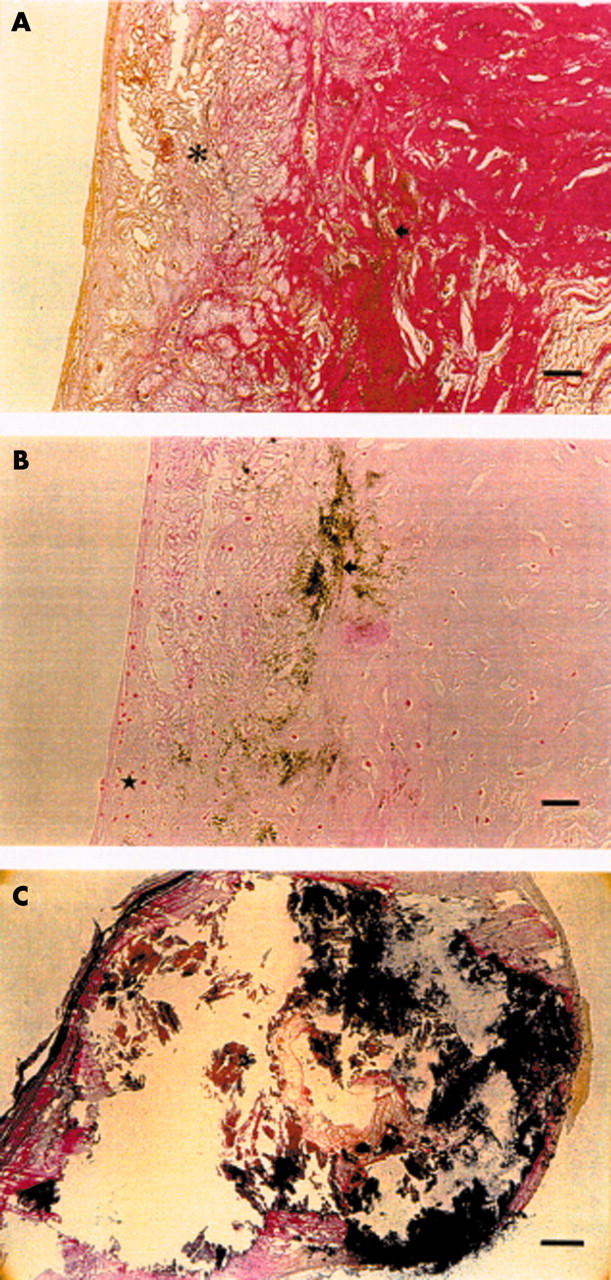
Photomicrographs of advanced lesions in the oldest age group. (A) Verhoeff-van Gieson stain shows cholesterol crystals (asterisk) and mineralisation (arrow). Bar = 60 μm. (B) Von Kossa stain shows slightly increased cellularity (star) as well as mineralisation (arrow) in the same specimen. Bar = 60 μm. (C) A large calcified lesion. Bar = 100 μm. Verhoeff-van Gieson stain.