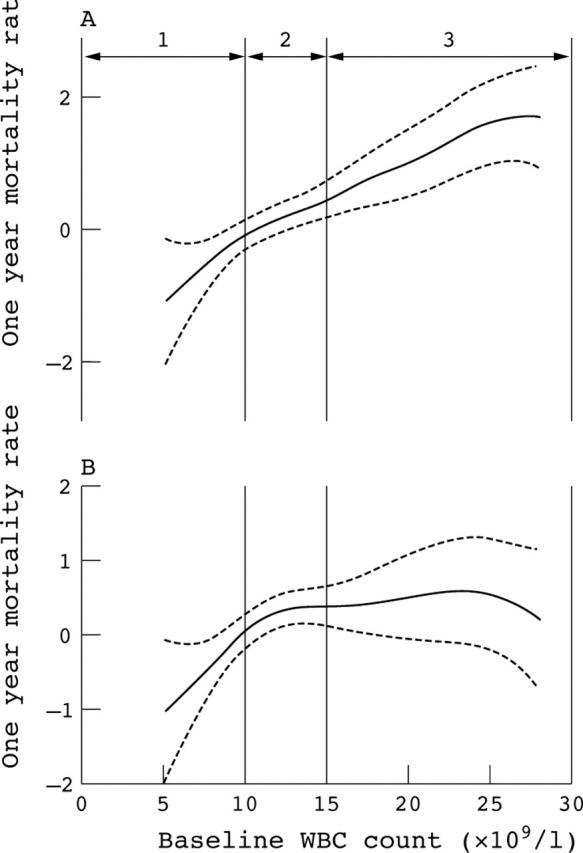
Figure 1.

GAM plot characterising the relation between mortality rate and each value point in the continuum of WBC-C. Dash lines are 95% CI. Numbers 1, 2, and 3 represent the stratums created when categorising WBC-C. (A) Univariate analysis. (B) Analysis adjusted by age, sex, Killip class, systolic blood pressure, reperfusion, new onset bundle branch block, and serum creatinine.
