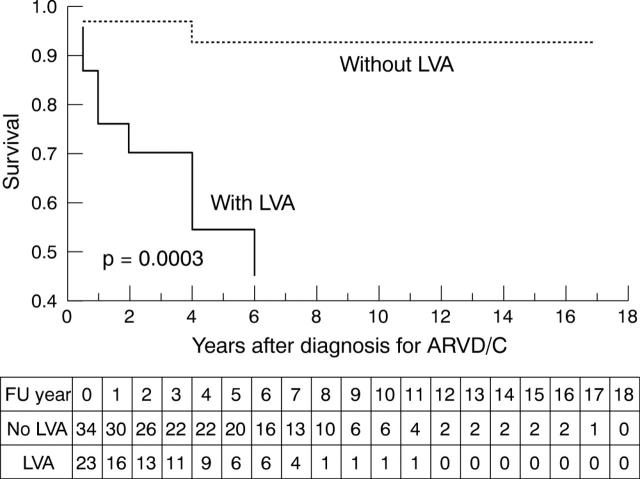
Figure 3.
Kaplan-Meier survival analysis (cumulative proportion surviving) of 57 patients with ARVD/C (time from correct diagnosis to cardiac death or heart transplantation) comparing the group of patients with left ventricular abnormalities (LVA) (n = 23) with the group without LVA (n = 34) (p = 0.0003). The numbers of patients remaining at risk for death or heart transplantation during follow up (FU) are listed beneath the plot.

