
Figure 4.
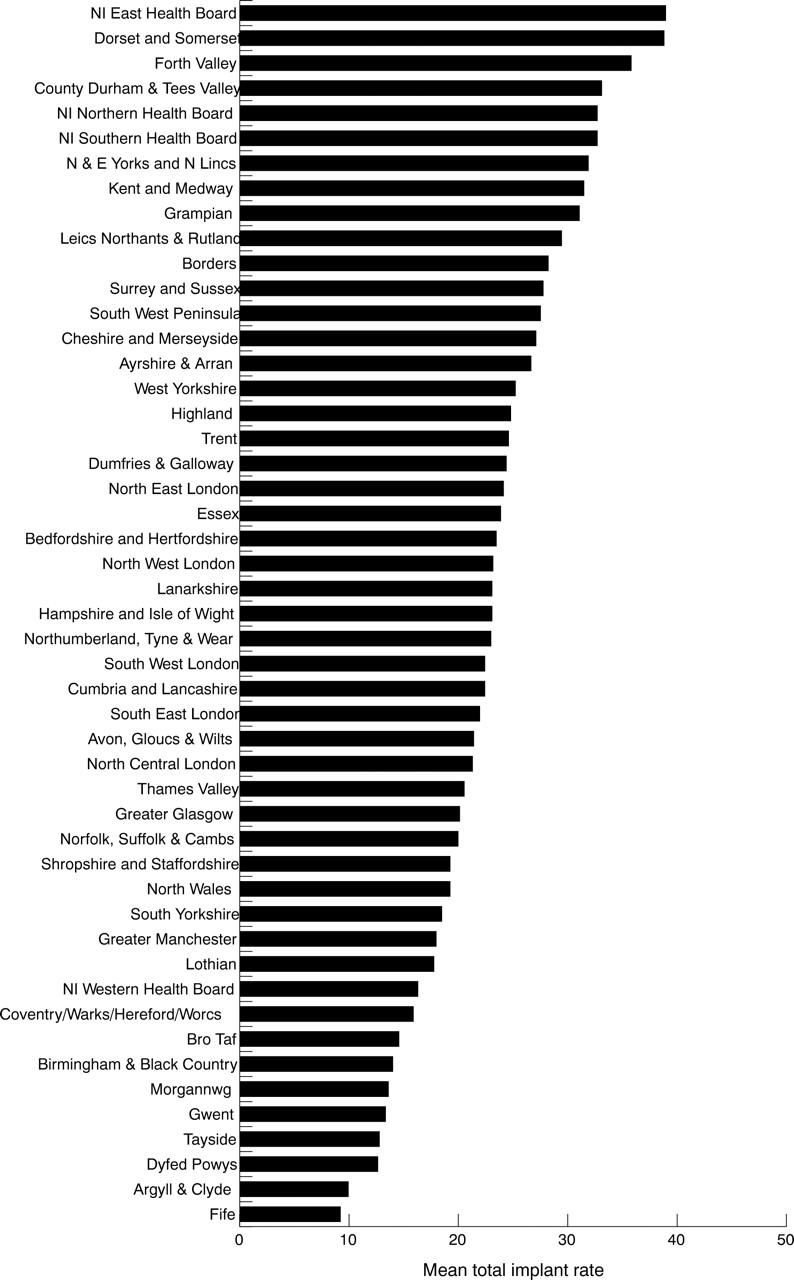
Mean annual ICD implantation rate per million population in each UK strategic health authority with a population of at least 100 000 in 1998–2002.
Official websites use .gov
A
.gov website belongs to an official
government organization in the United States.
Secure .gov websites use HTTPS
A lock (
) or https:// means you've safely
connected to the .gov website. Share sensitive
information only on official, secure websites.
Mean annual ICD implantation rate per million population in each UK strategic health authority with a population of at least 100 000 in 1998–2002.