
Figure 6.
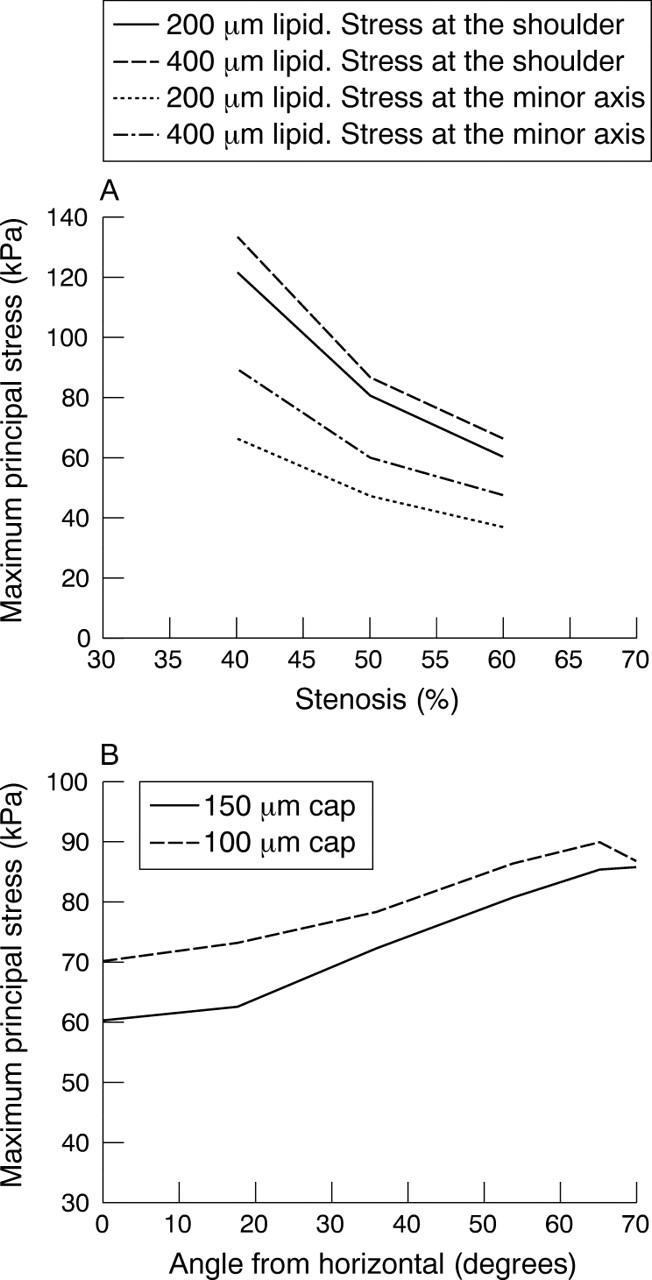
(A) Variation of stresses with percentage stenosis. Stresses were measured at the minor axis and shoulder for two lipid sizes, namely 200 and 400 μm. Ellipse 1:1.25, 150 μm cap. (B) Variation of stress with cap thickness. Elliptical lumen of 1:1.25 aspect ratio.