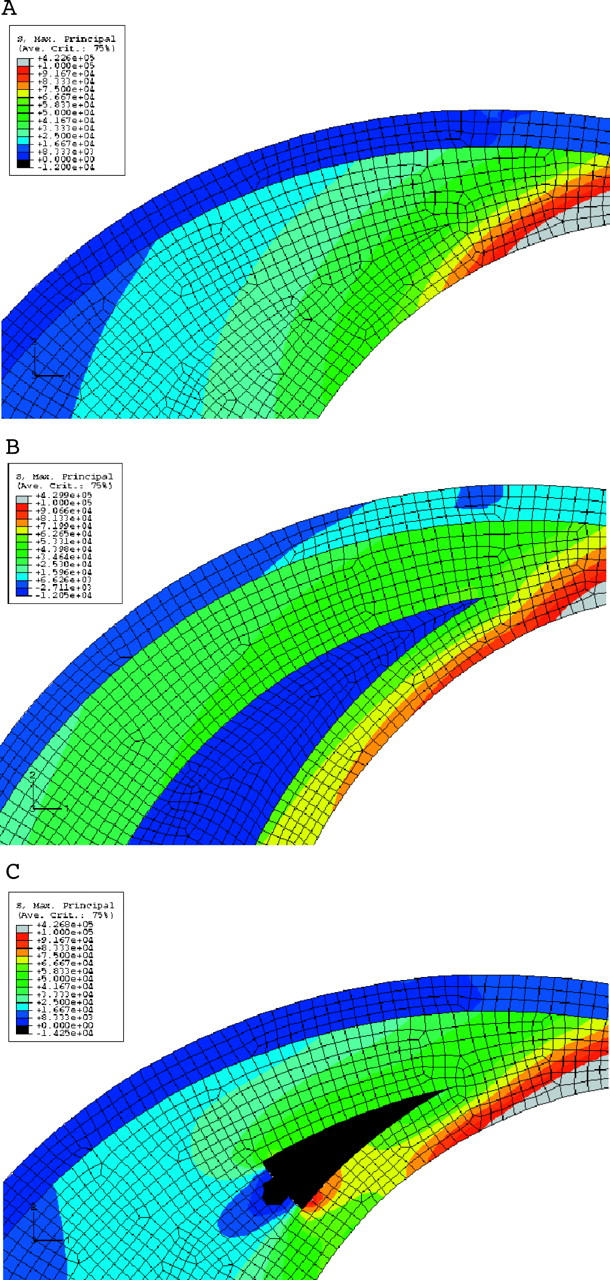
Figure 7.

(A) Stress distribution near the shoulder region of the plaque. No lipid is present in this case. This brings out the increase in the stress near the shoulder even without the lipid. (B) Stress distribution near the shoulder region of the plaque. Lipid is crescent shaped. Note the increase in stress at the cap compared with (A). (C) Stress distribution near the shoulder region of the plaque. A small amount of lipid is introduced near the shoulder. Note the increase in stress near the shoulder. The increase is about 17% near the shoulder.
