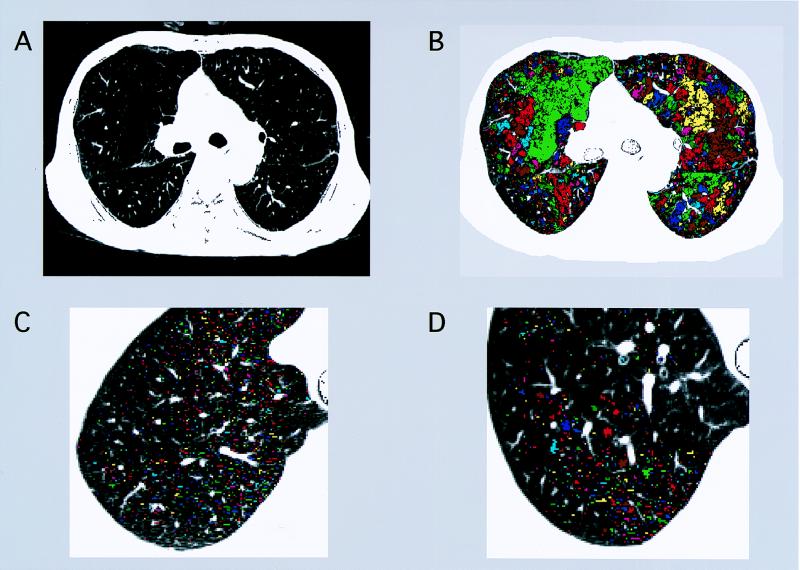
Figure 1.
(A) Original CT image of the middle lung slice in a representative COPD patient. LAA% is 55.1. (B) The same image as in A, but the individual clusters comprising contiguous LAA regions are shown in contrasting colors. The lung field was identified from the rest of the image, and the lumen of the trachea and large bronchi were excluded. The white regions are smaller airways and vessels. (C) LAA image of a normal subject. (D) LAA image of a COPD patient. The LAA% and exponent D of the cluster distribution of the two images in C and D are 7.2 vs. 7.1 and 2.97 vs. 1.71, respectively.

