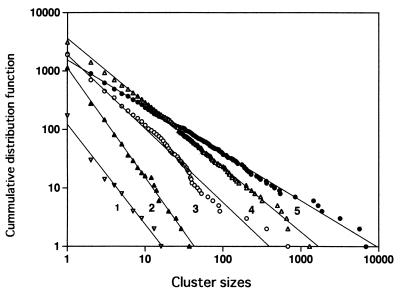
Figure 2.
Log-log plot of representative cumulative frequency distributions of LAA size. The five lung slices analyzed had LAA% values of 5.1 (1), 15.6 (2), 30.9 (3), 42.3 (4), and 60.4 (5). Eq. 1 then was fitted to the plots by linear regression. In these five cases, r has a value of 0.991, 0.997, 0.987, 0.998, and 0.998, respectively. The corresponding D values are 1.71, 1.87, 1.26, 1.10, and 0.64, respectively.

