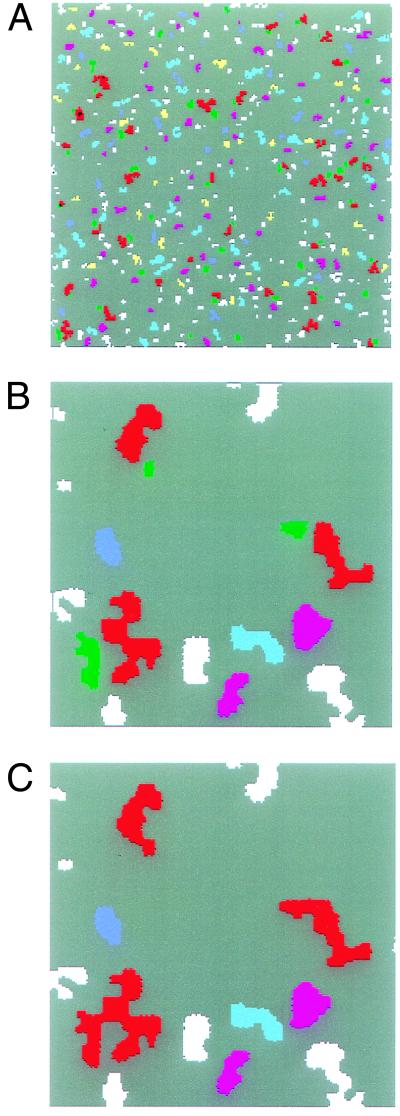
Figure 6.
Images obtained from simulations using a square lattice (500 × 500) of nodes connected by springs. The lattice constant is 1. The different colors represent LAA clusters in which several nodes have been removed from the network. (A) A 250 × 250 zoom in to the lattice. (B) Zoom into a small area (50 × 50) of the lattice in A. Notice that the three larger red clusters and the smaller neighboring green clusters are separated by tissue (gray). (C) The same network as in B but after 554 additional springs (whose tension was higher than 80% of the maximum tension) have been cut out of the 500 × 500 network. The tension in the walls separating the red and green clusters in B was high, and the alveolar walls broke. As a result, the green clusters are now part of the larger red clusters.

