Figure 3.

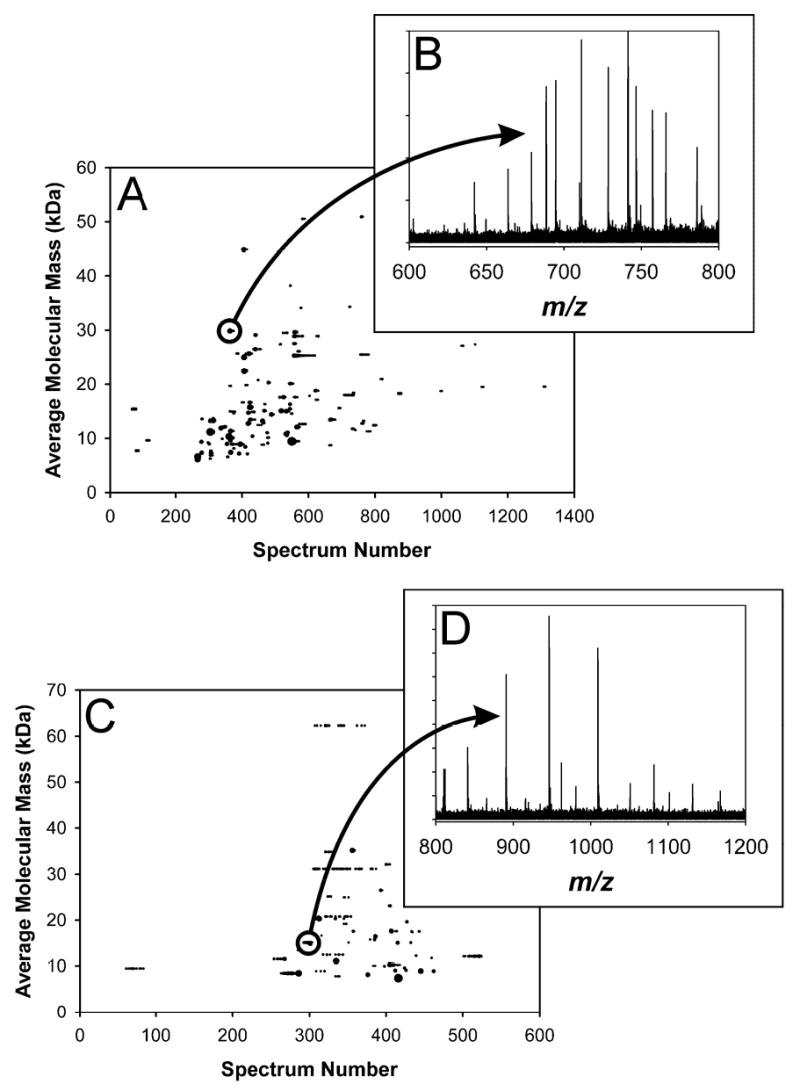
Comparison of (A) RPLC-FTICR-MS with (C) CIEF-FTICR-MS data, displayed as 2-D plots, for S. oneidensis cell lysate; CIEF sample preparation, in addition, required dialysis to reduce salt concentrations. 142 proteins were detected in the RPLC run, while 58 were detected in the CIEF run. (B) is the mass spectrum for the indicated spot in (A); the measured mass (average isotopic composition) for this spot was 29832.40 Da, which matches the mass of ribosomal protein L2 (SO0234) minus methionine at 9.6 ppm error. (D) is the mass spectrum for the indicated spot in (C); the measured mass (average isotopic composition) for this spot was 15127.80 Da, which matches the mass of hypothetical protein SO0691 at 0.3 ppm error.
