
Figure 4.
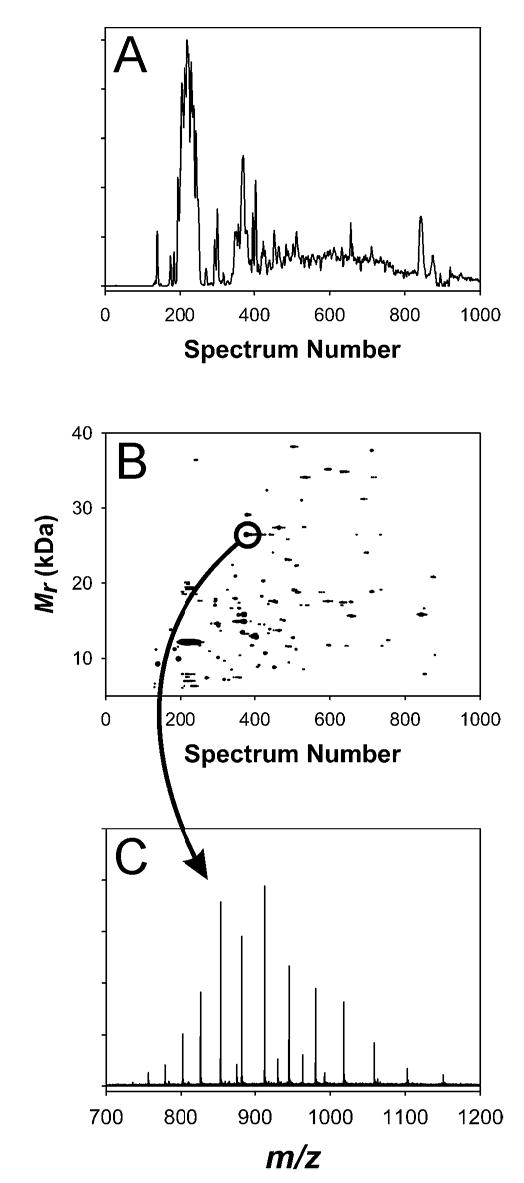
(A) TIC and (B) 2-D plot for SEC Fraction 5. (C) is the mass spectrum for the indicated spot in (B); the measured mass (average isotopic composition) for this spot was 26445.11 Da, which matches the mass of conserved hypothetical protein SO4719 minus a predicted signal peptide at 6.6 ppm error.