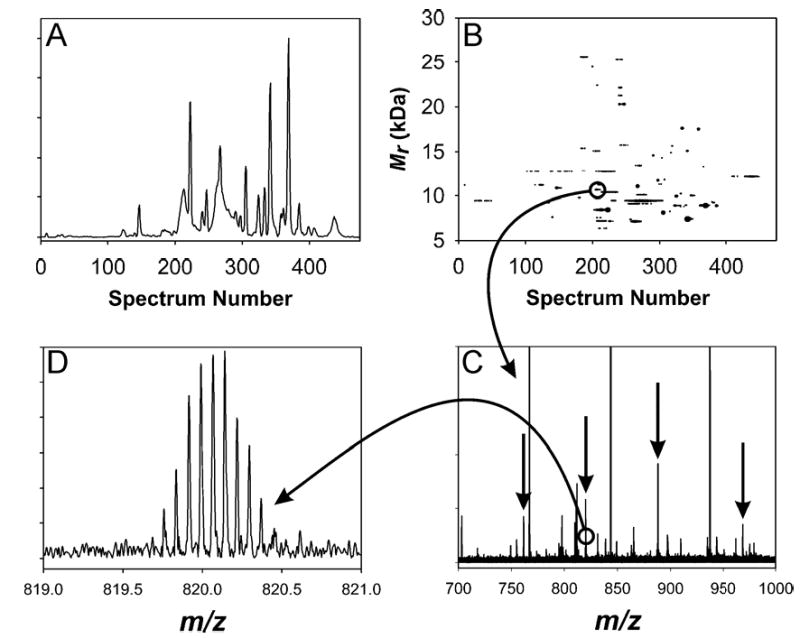
Figure 5.

(A) TIC and (B) 2-D plot for RPLC Fraction 4. (C) is the mass spectrum for the indicated spot in (B); arrows highlight the peaks that constitute the indicated spot; the measured mass (average isotopic composition) for this spot was 10648.27 Da, which matches the mass of integration host factor beta subunit (SO2401) at 4.6 ppm error. (D) is an expansion of the 13+ peak that exemplifies the isotopic resolution achievable even for less intense peaks.
