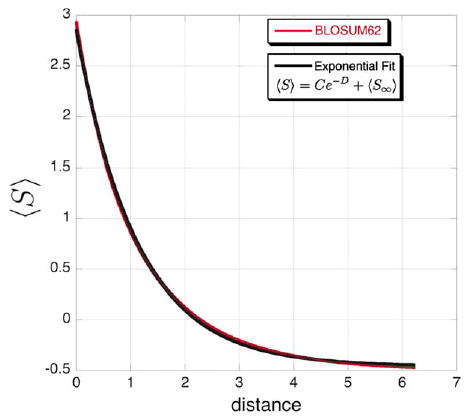
Figure 5.

Exponential decay approximates the change in expected log-odds score with time. The red line is a plot of the exact change in the expected log-odds score using a BLOSUM62 matrix and its implicit instantaneous rate matrix as given by equation (2). The black line is a χ2 best fit of equation (2) using a BLOSUM62 matrix to an exponential decay (〈S〉=3.31 e−0.8906−0.460, R = 0.99972).
