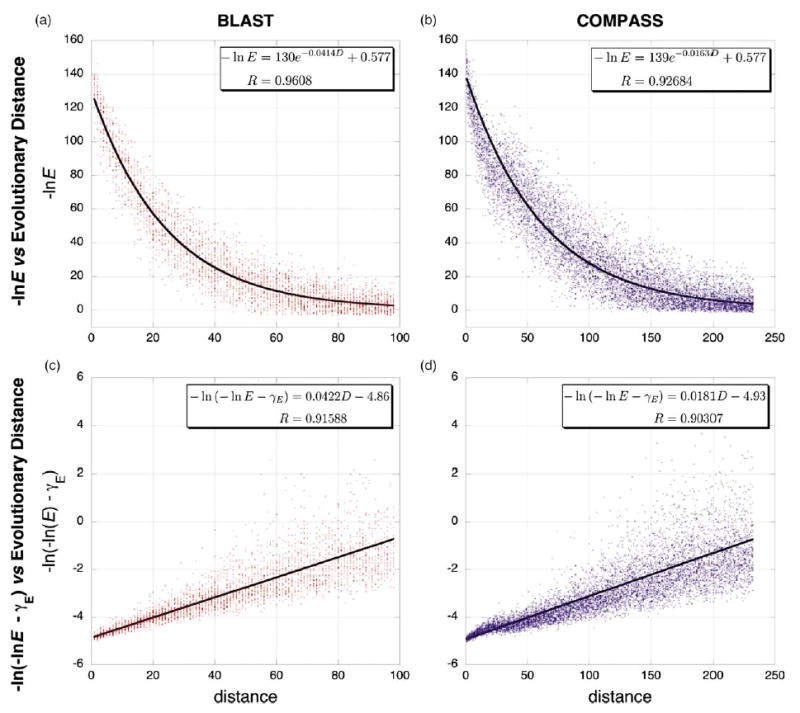
Figure 6.

Theoretical fits of the E-value/distance relationship from simulated protein evolution data. Representative data from simulated protein evolution of pairwise sequences is shown at left in red (a) and (c) and of sequence alignments is shown at right in blue (b) and (d). (Dawg, JC nucleotide evolution model, gamma rate variation α=1, negative binomial model of indel evolution, relative insertion probability=deletion probability =0.04). The upper two graphs (a) and (b) plot ln(E) versus evolutionary distance and show data fit to equation (C3), where 〈Scen〉 is given by equation (2) and 〈S∞ 〉=γ. The lower two graphs (c) and (d) show the same data, plotted as ln(−ln E−γ) versus evolutionary distance and fit with equation (4). The constant ln C was not fit but was estimated as described in Materials and Methods. Because the variance increases with evolutionary distance in the latter two plots, these fits were weighted by the inverse of the evolutionary distance (analogous to weighting by the inverse of evolutionary distance in the phylogenetic least-squares analyses). In all graphs, the largest plotted distance corresponds to an E-value of 0.1.
