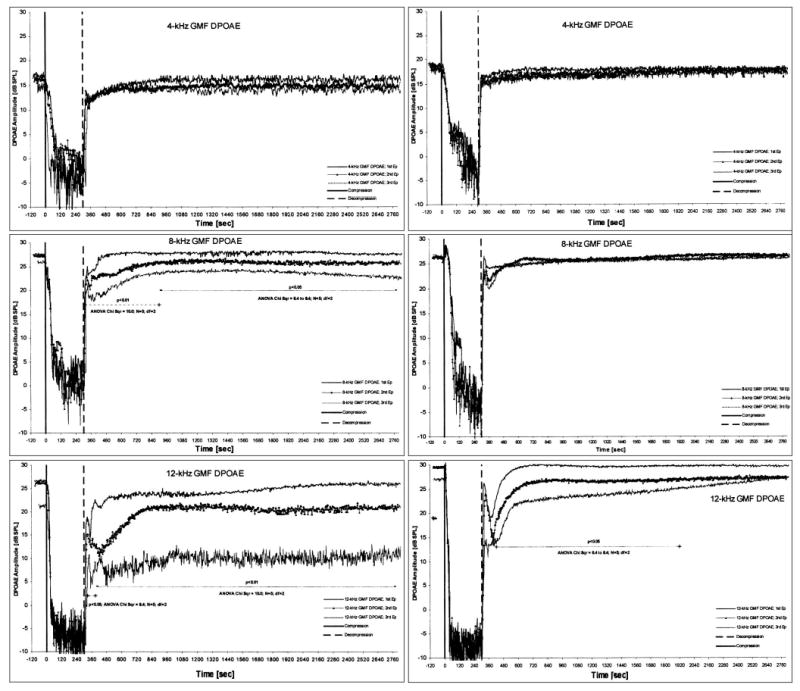
Fig. 2.

The time courses of median values for all subjects of distortion-product otoacoustic emissions (DPOAEs) during and following the subsequent 5 minute internal auditory artery (IAA) compressions in five control ears pretreated with saline (left) and five experimental ears pretreated with mannitol (right) recorded at 4 , 8 , and 12 kHz geometric mean frequency (GMF) DPOAE. Results of comparisons of DPOAE values measured during and following the subsequent ischemic episodes for given frequencies using Friedman’s analysis of variance (ANOVA) test.
