
Figure 6.
Glutamatergic Terminals of Mossy Cells Contain Functional CB1 Receptors
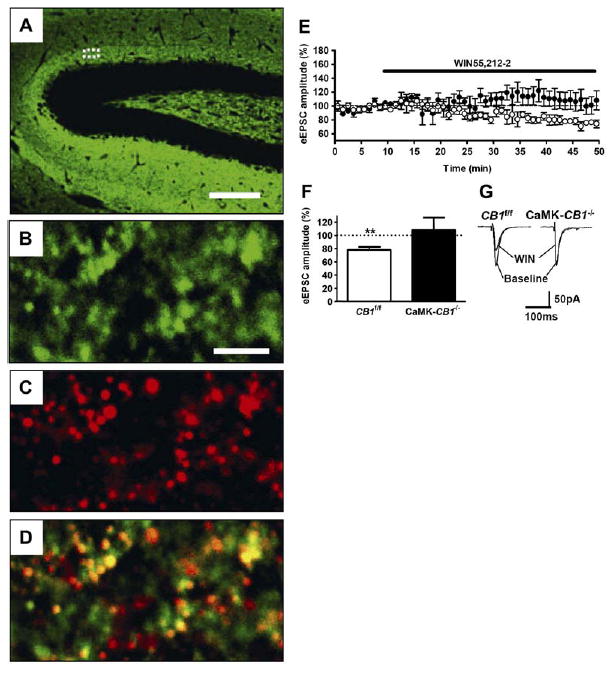
(A) Low-magnification micrograph showing expression of VGluT1 protein in the hippocampal formation.
(B–D) High-magnification confocal micrographs showing detailed expression of CB1 and VGluT1 protein in the inner third of the molecular layer (approximately corresponding to the dotted area in [A]). Expression of VGluT1 (green, [B]), CB1 (red, [C]), and merged image (D) are shown. Yellow areas indicate colocalization of the two proteins.
(E–G) Activation of CB1 receptors reduces glutamatergic inputs onto dentate gyrus granule cells.
(E) Time-course analysis of the effects of 5 μM of the CB1 agonist WIN55,212-2 on eEPSCs in wild-type (CB1f/f, open circles, n = 6 slices from three mice) and CaMK-CB1−/− littermates (filled circles, n = 6 cells from three mice).
(F) Summary of eEPSCs data obtained by calculating the average of the measurements obtained during the last 5 min of experiment (35–40 min after drug application).
(G) Representative electrophysiological traces before (baseline) and 40 min after application of WIN 55,212-2 (WIN).
Bars, 75 μm (A), 3.5 μm (B–D); **p < 0.01 as compared to baseline (average of the measurements during the last 5 min before drug application, dotted line).