Fig. 4.

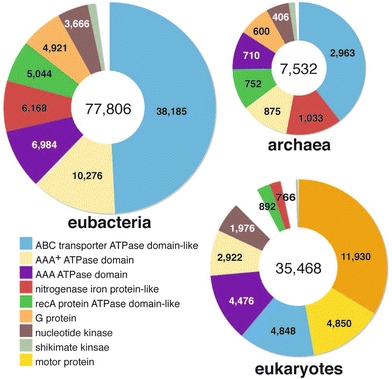
Protein family distribution of ‘P-loop containing nucleoside triphosphate hydrolases’ superfamily in each kingdom. In the three pie charts, the section with the same color is a category of the same family except for the white section

Protein family distribution of ‘P-loop containing nucleoside triphosphate hydrolases’ superfamily in each kingdom. In the three pie charts, the section with the same color is a category of the same family except for the white section